Remote Device Fleet Manager (RDFM) is Antmicro’s open source system for overseeing, monitoring, and updating large fleets of distributed devices. You can use it to update the software in your devices remotely, as well as track their status, manage their configurations, and more. Antmicro launched this system back in 2023, and with multiple updates since that time, e.g. over-the-air streaming updates for NVIDIA BSP, and the xdelta algorithm for more efficient updating, a growing number of customers have been making extensive use of RDFM with their deployed device fleets.
With the recent expansion to RDFM’s features, you can use the optional telemetry module to process data from all authenticated devices in your fleet, and accumulate it on your server. You can then use that data to generate graphs with statistics, and other visualizations, and possibly automatically detect issues or identify opportunities for optimization.
In this article, we take a look at how you can deploy the telemetry module for RDFM, how to authenticate your devices, what data you can collect with the telemetry server, and how you can generate graphs from it.

Telemetry for RDFM: sample use case
In a practical application, we had cameras in a monitoring system, which was functioning properly. However, every day around midday, the camera feeds showed issues, as we saw dropped framerates in the feeds, and some of those were blocked completely for some time.
We used the telemetry module for RDFM, which was able to collect timestamped data from all cameras for diagnostic purposes. We diagnosed the CPU and RAM usage, network uplink stability, data transmission rates, voltage, and temperatures.

Contrary to the suspicion of overheating issues, caused by elevated ambient temperatures at that time, the diagnostic data pointed to CPU load spikes around midday.

Upon further investigation, we were able to identify a misconfigured process in the cameras which tried to contact the update server multiple times around noon, thus causing the increased system load; the issue in that process was promptly fixed.
Running a demo
RDFM can collect telemetric data such as CPU, memory, and drive usage, sensor input, camera framerates, etc. The authorized devices transmit the data over to a dedicated server (Kafka broker), which aggregates the data. The aggregated data can then be read from that server at any time - including for generating graphs locally.
To launch the telemetry demo, with the the help of Docker, use the provided docker-compose.kafka.yml configuration (a part of the RDFM repository on GitHub). The demo deployment consists of:
- a single Kafka broker server instance - for receiving log entries from a Linux client,
- an RDFM management server instance - for authenticating the client, after the user calls the
rdfm-mgmtutility manually from a host (more on this in the section below), - an RDFM Linux client instance - for reporting logs to the Kafka broker, after being authenticated.
Alternatively, the RDFM Linux client instance can be run in Renode, as an image that is capable of sending its telemetry data; the setup is described in the README file, section “Renode Machine Setup”.
Once you have the selected demo running for a moment, the logs can be inspected using the rdfm-plotter utility, which consumes the messages from the broker. The usage of that tool is described in its README file.
Device authentication
To set up the RDFM management server, call rdfm-mgmt from a host:
CERT=<INSERT_PATH_to_your_CA_CERTIFICATE>
DEVICE_MAC=00:00:00:00:00:02 # The mac of interest is visible in the docker compose logs when the device is reaching out to the server
rdfm-mgmt --cert $CERT --url https://localhost:5000 --no-api-auth devices auth $DEVICE_MAC
The telemetry module authenticates itself to the data broker with:
JWTfor devices (rdfm-jwt-auth), andOAUTHfor management and message services (strimzi-kafka-oauth).
A device is considered authenticated if it has a valid JWT token (issued by the RDFM management server); its validity can be determined by rdfm-jwt-auth (a custom extension in Kafka). The broker (Kafka) acts as an intermediary between a device producing the data and a client wanting to retrieve the data.
The config is client-side and tells the device what kind of data it should transmit over. Specifically, the config describes what recurring executables to run, and at what intervals, and then captures the outputs of these executable files and transmits them to the Kafka cluster (a set of Kafka brokers can be clustered to manage larger computational loads or replicate logs for safety).
Telemetric data collection
RDFM can collect telemetric data by invoking various utilities or commands on the host device, and simply collecting their output. These are scheduled at predetermined intervals and are fully configurable.
Here is an example configuration (from the demo):
[
  {
    "name": "CPU",
    "path": "/opt/rdfm/CPU.sh",
    "tick": 1500
  }
]
The above simply states: run the script called CPU, located in /opt/rdmf/CPU.sh, every 1500 milliseconds.
The setup of these scripts and utilities is up to you, when preparing the Board Support Package, and there are validation checks done in the meta-antmicro layer that will notify you of any discrepancies they find.
After this script is ran, the RDFM Linux client reads its output, and performs preprocessing (e.g. timestamping, then serializing the data) before sending it to the broker.
Using the data to generate visualizations
The segmented data can next be processed into visualizations, such as block diagrams, graphs, tables, or timelines. Information such as filled data drives, framerate drops, and high temperatures can be very useful in tracking issues such as corrupt or missing data, overloaded CPUs, memory leaks, and overheating - to name only a few cases.

The info stream that comes from a device (with the the output of its programs, utilities, and scripts, among other things) is a time series by itself, as it contains timestamps. That means each message received from a device can occupy a spot on the time axis, so data can be conveniently plotted.
When you instruct rdfm-plotter to plot the data from the past hour, it will:
- determine the offset (on the broker) by calling
getOffsetsByTimes, based on the chosen timeframe, - set that offset and start consuming onward, to consume the messages from the selected timeframe, and
- plot the extracted data, after sorting it by
device_time.
In practice, the messages can be identified by their keys. In the example found in the section above, "name" corresponds to a key, so each output of the script CPU.sh will be of key CPU, which can be used for filtering.
As another example, the TUI-based diagram below presents a timeline with CPU stress test in a client ran in Docker:
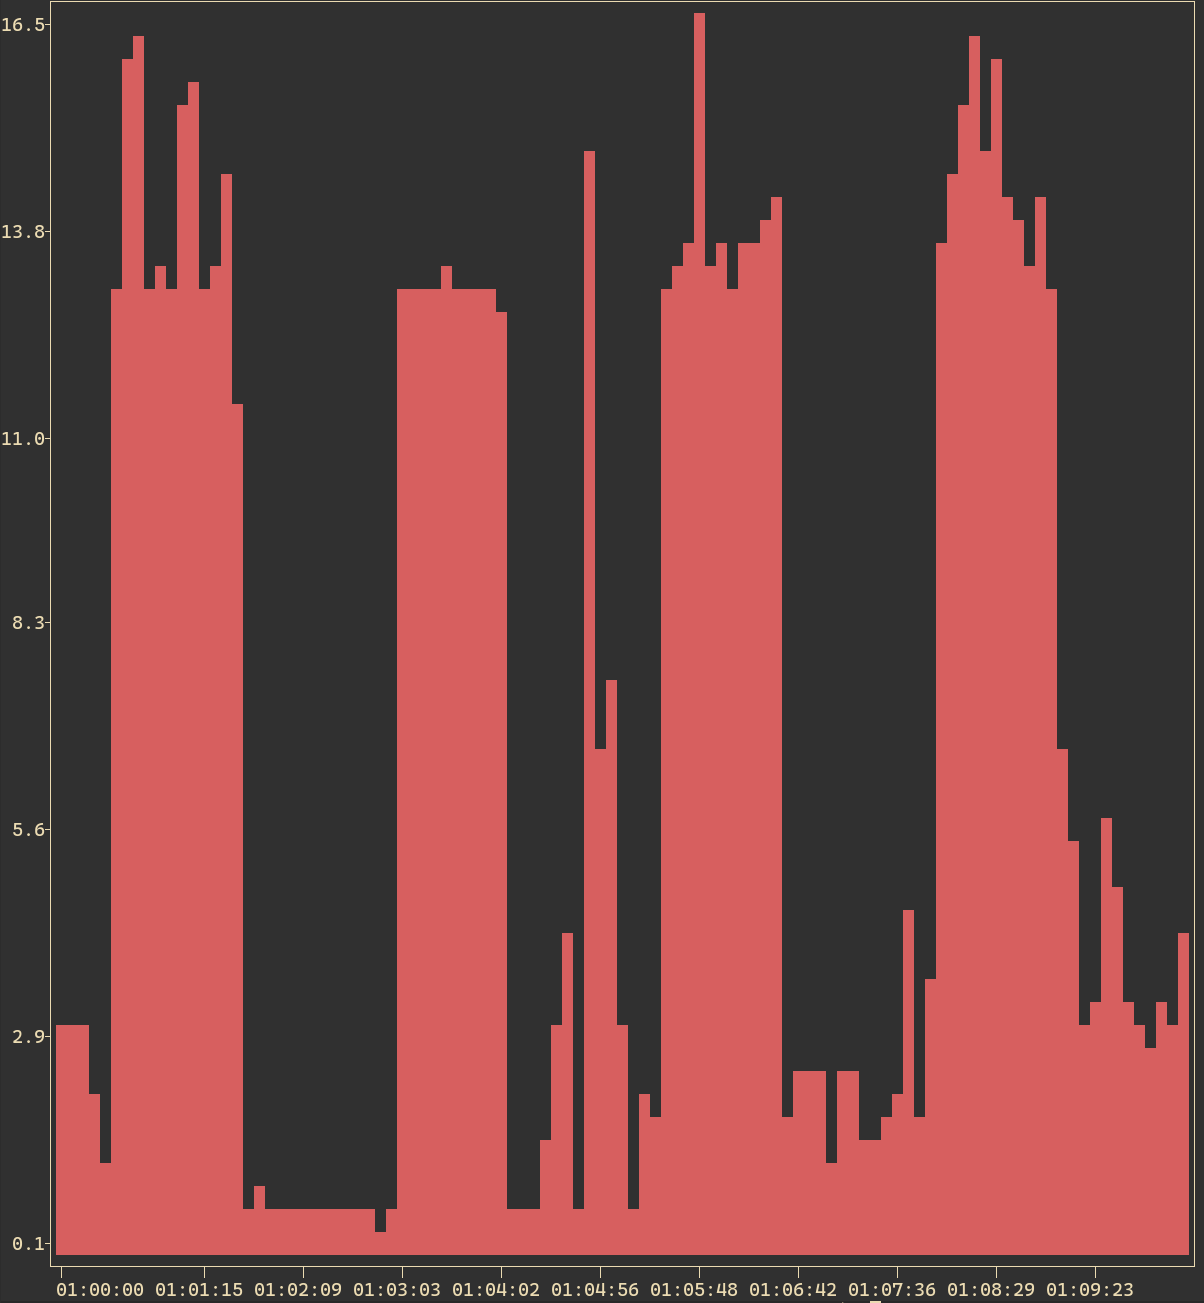
There are practical examples you can find inside the rdfm-plotter repository.
Future features
For one of our customers, we are currently developing a panel that allows the admins to access the telemetric data of any device in the fleet, in Device View.
Another feature planned for a future release is the provisioning of separate, organized space for each device to produce its messages, by the RDFM management server; this will constitute an implementation with minimal, lightweight footprint, as not even a database table will be involved.
The RDFM management server will also be capable of deauthenticating a device, once this method is made available in RDFM itself.
Telemetry in RDFM for your device fleet
RDFM is an open source system that enables you to manage your device fleets in a convenient way. Now, it features the additional tools to collect, process, plot, and oversee complex granular data from all devices easily.
Antmicro can help you establish an RDFM-based platform with an over-the-air update distribution system for your device fleets. We can additionally help you enable a complementary WebUI and create visualizations from the collected data, together with the telemetry module, configured to collect and process the data your require. Reach out to us at contact@antmicro.com to discuss your use case.


