When developing AI applications for embedded platforms, it is crucial to properly identify execution bottlenecks which are heavily dependent on matching between the architecture of your model and the capabilities of the hardware and toolchain. With the right data, you can adjust your AI model or tweak the implementation of the runtime to better leverage the available hardware acceleration (and avoid its limitations).
The number of embedded platforms running on Zephyr RTOS is constantly growing, including constrained edge AI devices, where optimization becomes critical. Some time ago, in collaboration with Analog Devices, Inc (ADI), Antmicro built a module around the Kenning open source framework, called AutoML, with a comprehensive toolset for developing and optimizing AI solutions on embedded platforms with automated Neural Architecture Search and model optimization. This became also available as a VSCode plugin.
In a further push for optimization, and to allow developers to search for bottlenecks and improvements in their applications, again in collaboration with ADI, we have implemented and released Zephyr AI Profiling Library - or Zephelin, for short. It is a fully open source tracing and profiling tool for the Zephyr RTOS, which allows you to trace the execution of your RTOS applications while collecting information about the system state. On top of this, it also tracks and reports the statistics specific to the executed AI models, using runtimes such as LiteRT or microTVM, giving you information about the executed layers, their parameters, used tensors, and the associated processing time and consumed resources.
In this blog article, we take a look at how you can use Zephelin to verify your Zephyr AI applications and ensure they are working optimally.

What Zephelin is and how it works
Zephelin is a library which enables capturing and reporting runtime performance metrics for profiling and analyzing Zephyr applications, with a special focus on applications running AI/ML inference workloads.
Zephelin uses several existing subsystems in the Zephyr RTOS, such as:
- Tracing Subsystem - offers hooks that allow you to gather data from your application, and enable host-based Tracing Tools, to visualize the host’s various subsystems and the system kernel’s internal operations.
- Thread Tracing API - provides thread info and thread switching details.
westbinary analysis tools - allow you to analyze Footprint and Memory Usage, as well as Data Structures, with the use of different build system targets.- Memory Management - allows you to track allocations and other metrics related to memory.
For the purpose of enabling even deeper performance analytics, Antmicro and ADI have recently introduced a new Instrumentation subsystem to Zephyr’s mainline. The Instrumentation subsystem uses the compiler’s instrumentation feature (-finstrument-functions) to inject user-provided function calls before and after every specified function. You can either specify the files with functions to track, or the names of functions. This can provide fine-grained details on function stops/starts in the trace, and allow probing the subsystems of interest before and after a function.
Furthermore, Zephelin elevates mechanisms available in popular AI runtimes to observe the model execution with the use of dedicated profilers:
- For LiteRT, we created MicroProfiler which obtains information on not only what layer types are being executed, but also which layer in the network is currently running. It also provides information on the usage of the Tensor Arena, which is a memory workspace for LiteRT.
- For TVM, we created TVMProfiler which measures the timing before and after layer execution.
Based on the information collected from any of those runtimes, you can later oversee matters such as the dimensions of tensors used in the layers, hyperparameters of the layers, per-layer resource usage, processing time, and more.
Along with the traces, Zephelin collects the following data using the Zephyr subsystems:
- Memory usage over time
- Memory distribution based on RAM reports
- CPU usage
- Thread analysis
- Sensor readouts, e.g. DIE temperature
Tracing data from Zephelin
The diagram below presents the system components and data flow in Zephelin.
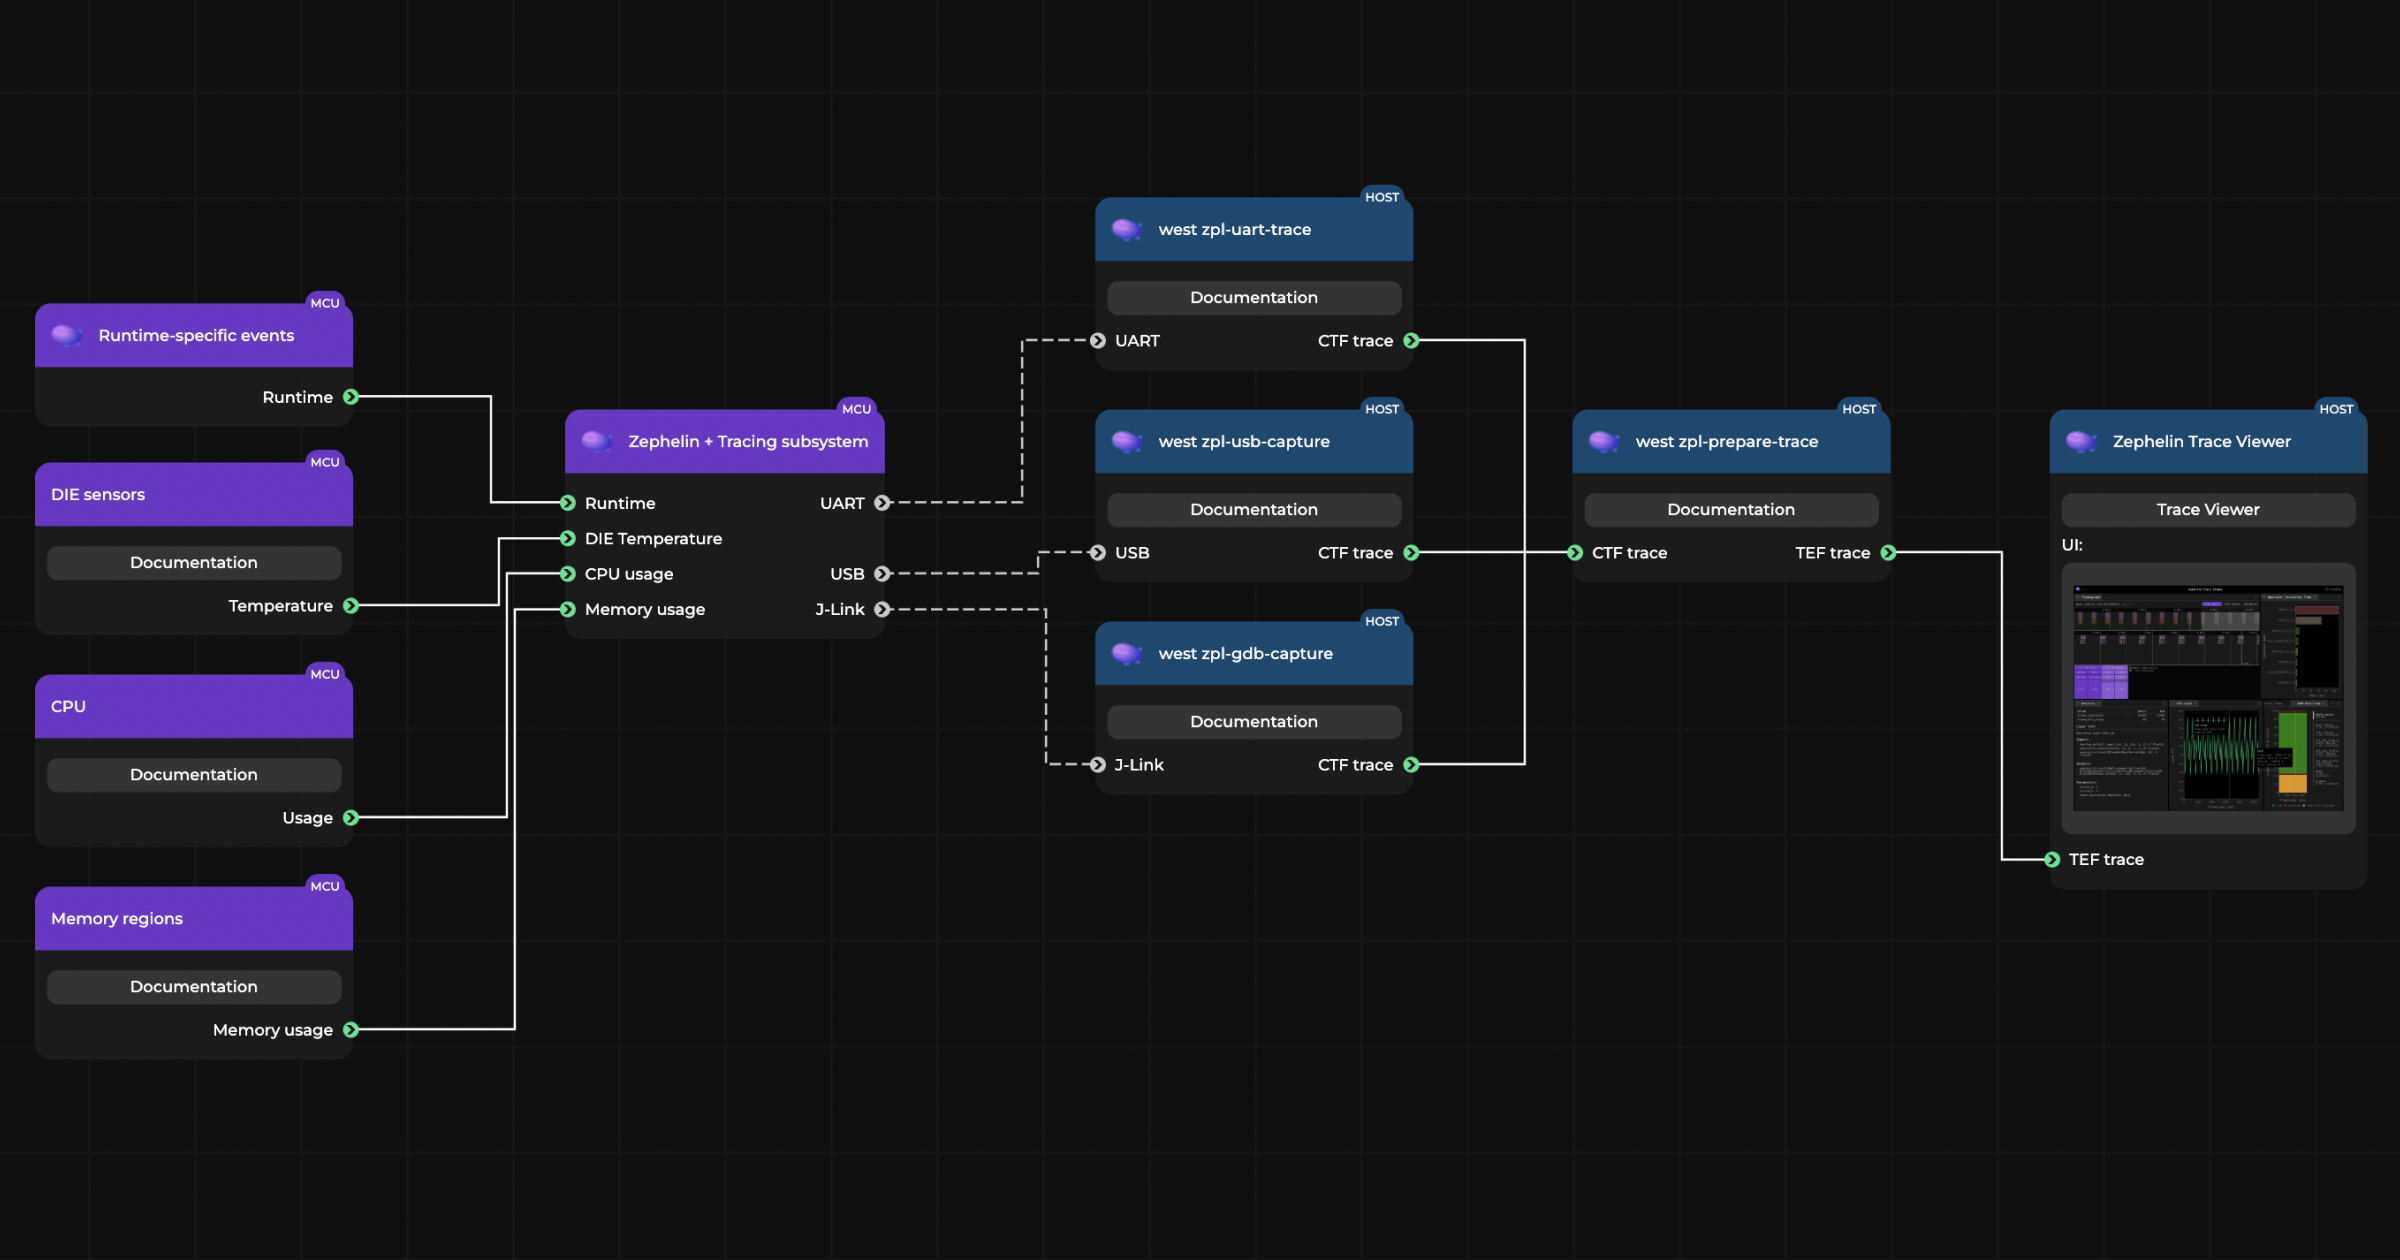
(For an interactive version of the diagram, visit the desktop version of the website)
You can obtain the tracing data in several ways:
- Via
west zpl-uart-capture- via UART. - Via
west zpl-gdb-capture- directly from the device’s memory using a debugger. - Via
west zpl-usb-capture- via USB.
The trace data can be delivered from the device, and directly by the Zephyr application, in two formats:
- Plain text - a human- and machine-readable format.
- Common Trace Format (CTF) - a binary format for efficient trace representation.
Within Zephelin, we also introduced a converter from CTF to TEF, providing the users with a wide range of tools for trace analysis. It is part of a new west subcommand called west zpl-prepare-trace. This subcommand:
- Converts CTF traces to TEF;
- Analyzes data delivered by MicroProfiler (LiteRT) or TVMProfiler (microTVM) along with the used model and its metadata, and presents model-specific data, such as executed layer types, or layer parameters; and
- Runs the
westRAM report to collect information about memory regions and the overall application structure.
The traces converted to TEF and enriched with the model and memory data can later be used in Zephelin Trace Viewer for a detailed overview and analysis, described later in this article.
Furthermore, Zephelin has several predefined profiling tiers, which determine how detailed the traces should be. There are three options to choose from:
- Minimal Mode - a lightweight mode adequate for basic tracing with almost no performance impact on the application; it is the best option when performance is critical, and only basic trace data is needed.
- Layer Profiling Mode - enables tracing the timing in the individual model layers; it offers more granularity.
- Full Trace Mode - for comprehensive profiling with extensive, in-depth tracing data; it incurs a performance overhead but provides an extensive insight into how your application works, and how it affects the device it runs on.
The profiling tiers, as the presets of Zephelin’s settings outlined above, are not the only way to adjust the tracing - you can granularly configure what exact information you’d like to obtain from the running application.
What is more, the vast majority of settings can be configured at will during runtime, giving developers opportunity to enable or disable certain settings based on manual feedback, e.g. via the UART shell.
Zephelin was also integrated with CodeFusion Studio, and will be available in the upcoming 2.0 release as a plugin for developers working with ADI platforms. It will also be available from ADI’s Developer Portal.
Quick introduction to Zephelin on the MAX32690 Evaluation Kit
You can test Zephelin’s tracing capabilities on ADI’s MAX32690 platform, using a demo application. The demo can be executed on actual hardware, or executed in Renode simulation. Renode allows you to test an end-to-end flow with Zephelin trace capture, including delivering CTF traces via different communication backends (USB, UART, GDB), simulating interactions as if it was running on actual hardware.
Integrating the Zephelin Profiling Library into your own Zephyr RTOS build is very simple. Zephelin is implemented as a west module, and its repository consists of the following elements:
- Zephelin library,
- Custom configurations of boards based on Analog Devices’ MAX78002 and MAX32690 (for testing purposes),
- Sample applications, which also serve as integration tests,
- Unit tests, and
- Patches to the Zephyr RTOS and other modules.
First, make sure all dependencies required by the Zephyr RTOS are installed - follow the Getting started guide.
Second, create a workspace and clone the following Zephelin repository:
mkdir workspace && cd workspace
git clone --recursive git@github.com:antmicro/zephelin.git
cd zephelin
Next, you will need to install west and additional dependencies, listed in the project’s requirements.txt, with pip:
pip install -r requirements.txtThen, initialize the workspace using west:
west init -l .
west update
west patch apply
west zephyr-export
west packages pip --install
west sdk install
source zpl_env.sh
In the end, download Renode and configure environment variables for the pyrenode3 package:
wget https://builds.renode.io/renode-latest.pkg.tar.xz
export PYRENODE_PKG=$(pwd)/renode-latest.pkg.tar.xz
You can run a simple demo with gesture recognition, based on the data from an accelerometer in a Renode simulation. The default configuration in this demo collects traces with all possible additional information (like memory usage, die temperature, or inference statistics), where one UART provides logs from the application, while the other UART returns CTF traces.
To build the demo, run:
west build -p -b max32690evkit/max32690/m4 samples/demoTo run it in a Renode simulation, run:
python ./scripts/run_renode.py
    --repl ./samples/demo/boards/max32690evkit_adxl345.repl
    --sensor i2c0.adxl345
    --sensor-samples ./samples/common/data/magic_wand/magic_wand_int8.data
    --trace-output trace.ctf
    --timeout 10
This demo will run for 10 seconds, after which the collected CTF traces (from the secondary UART) will be stored in trace.ctf.
Next, this trace data needs to be converted to TEF, so that it can be loaded into Zephelin Trace Viewer:
west zpl-prepare-trace ./trace.ctf
    --tvm-model-path samples/common/tvm/model/magic-wand-graph.json
    -o ./tef_tvm_profiler.json
To get an overview of the traces, go to the Zephelin Trace Viewer website and load the file tef_tvm_profiler.json.
Check the Zephelin docs to read full instructions on how to run the gesture recognition sample project with Zephelin.
Using Zephelin Trace Viewer
To analyze the data collected by Zephelin, you can use Zephelin Trace Viewer, a web application that processes TEF traces, together with additional information, obtained by Zephelin.
There are several ready-to-use demos available, including:
- Tracing a simple application for gesture recognition and movement detection with LiteRT runtime
- Tracing a simple inference with microTVM runtime
The entire UI is modular - you can easily add and remove panels (present in the default view). Let’s go over the available panels that demonstrate the application’s performance.
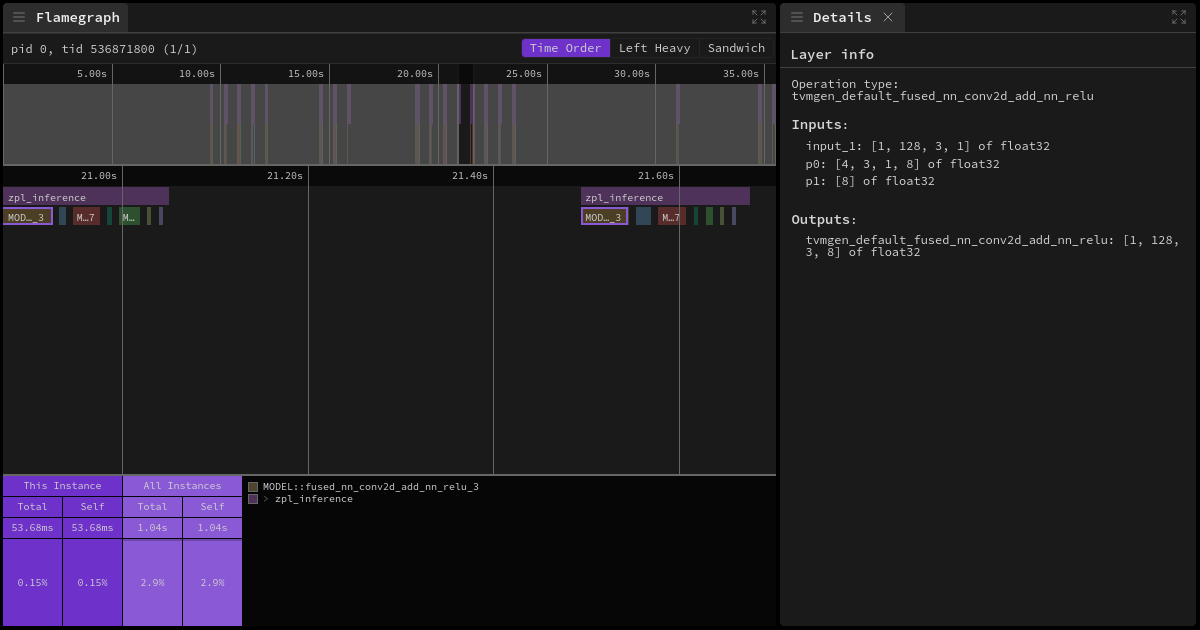
First of all, there is an interactive flamegraph with multiple modes:
- Time Order - displays traces on a timeline.
- Left Heavy - shows combined traces of the same type, and sorts them, starting from the most time-consuming ones.
- Sandwich - presents a summary table which contains all parent and child events.
You can also browse through the panels with details of the selected event. For example, for events associated with the inference of a model’s layer, the panels display information like the parameters of the layer, its inputs and outputs, as well as additional information related to the event.
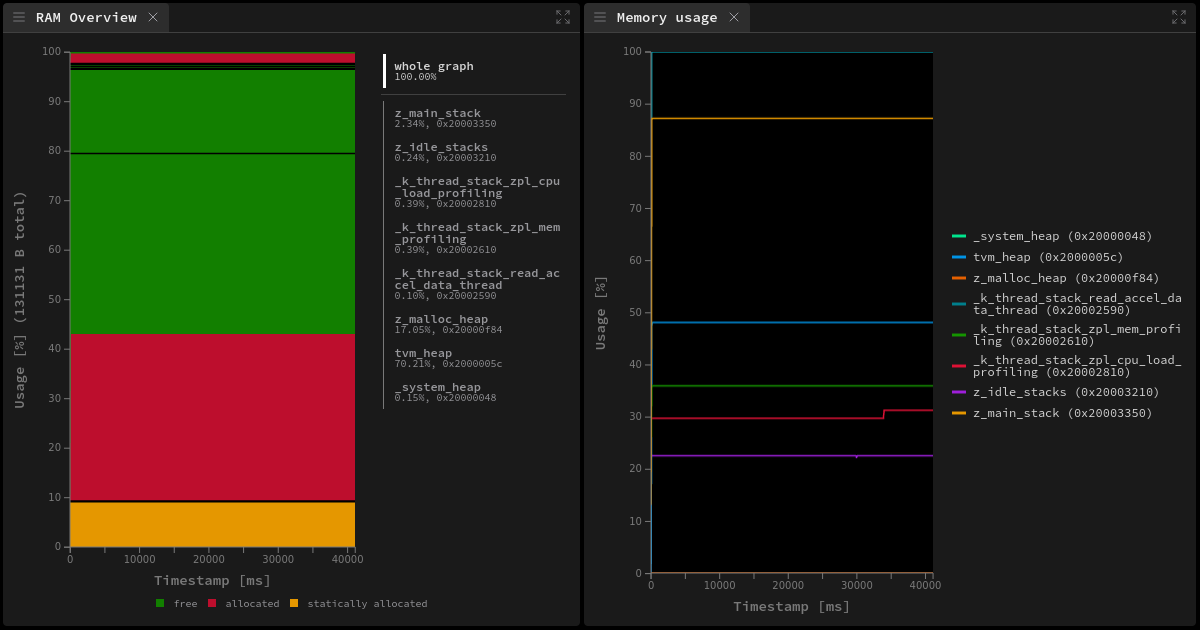
Another particularly useful element is the graph presenting the usage of memory regions over time, like stacks associated with threads, heaps, or mem slabs. There is the distribution of memory regions across RAM, in the form of RAM Overview, which includes:
- statistical allocation of the parts RAM parts, usually containing compiled applications and memory used by the operating system,
- changes to memory usage during the runtime, and
- comparison of memory region sizes.
This graph also allows you to zoom in on the selected region.
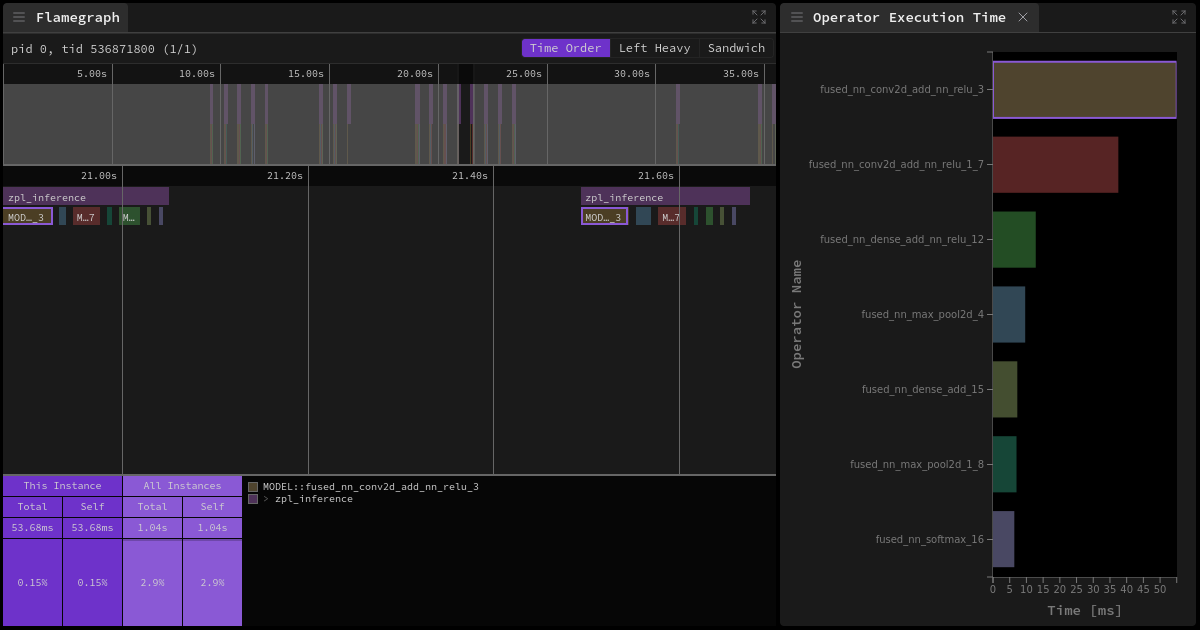
There are several graphs presenting how different instances or types of layers affect the runtime and consume resources. You can easily observe the average and total time spent on each layer, as well as how much memory it consumed.
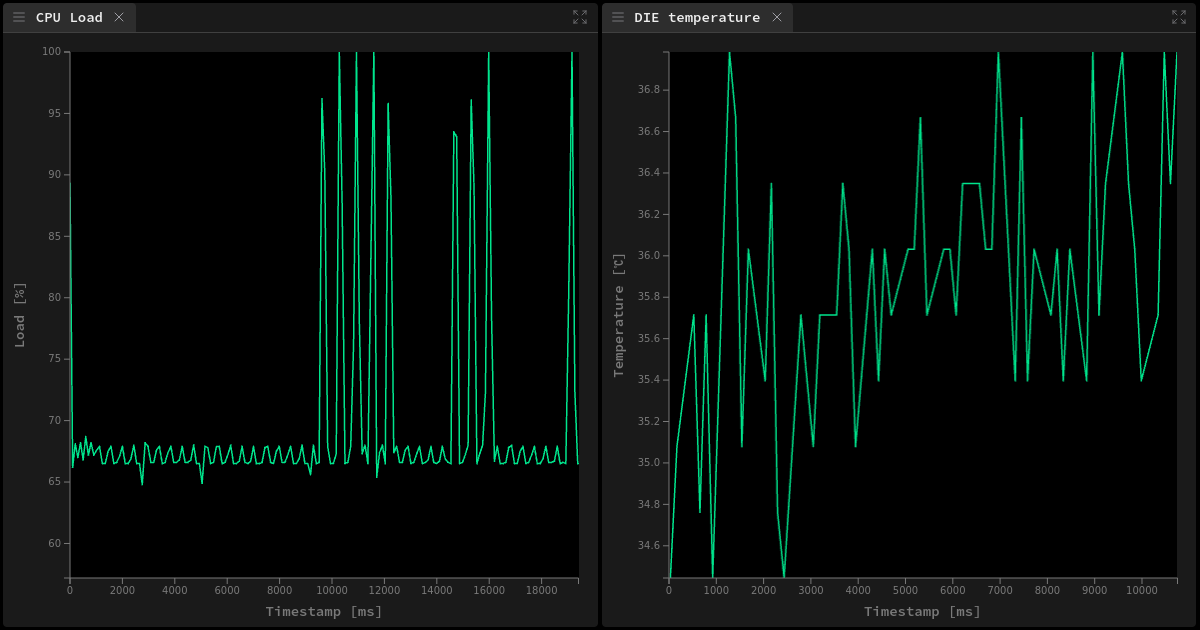
There are also time plots that demonstrate changes in readings from certain aspects of the system, such as CPU usage or DIE temperature, which allow you to monitor the extent of CPU utilization, as well as to observe anomalies resulting from high temperatures (as one example).
Zephelin for your embedded AI systems
Zephelin enables more efficient AI development on Zephyr platforms, helping teams develop innovative products with resource-constrained AI-enabled devices running the Zephyr RTOS.
If you require assistance with edge AI product development and optimization or are interested in optimizing your AI workflows or toolchains, including through Zephelin or Kenning AutoML, contact Antmicro at contact@antmicro.com. We can help you adopt a data-driven approach based on open source tooling for fast-turnaround edge AI development.