Debugging the Cortex-M4 core on the Vybrid SoC with OpenOCD
Published:
The Vybrid SoC is a heterogeneous CPU with a wide range of application possibilities. Through combining high processing and graphics performance of Cortex-A with low power consumption and RTOS support of Cortex-M (see e.g. the eCos port for Toradex Vybrid Colibri VF61 module developed by Antmicro), the Vybrid SoC is a perfect solution for Human Machine Interfaces present in various appliances and industrial machines.
A good example of an application for Vybrid was a plotter with a Qt GUI demonstrated at EW 2014 developed jointly by Toradex and Antmicro.
While working with Linux on Cortex-A is a well-known case that is described in at lenght in other places, programmers coming from a Linux background can have problems in figuring out how to debug the Cortex-M core of the Vybrid CPU.
We have had quite a few questions as to how this can be done, and so we decided to dedicate this note to briefly describe how to debug the Cortex-M4 core on the Freescale Vybrid SoC.
We will use OpenOCD in version 0.9.0. This version doesn’t support the Vybrid SoC, so we need to tweak it a little bit. This modification will probably work with other targets, but we have not tested it.
First we need to download OpenOCD version 0.9.0 and change the src/target/arm_adi_v5.c file. In line 665 change:
dap_ap_select(dap, 0);
to:
dap_ap_select(dap, 3);
That modification switches the DAP interface to allow access to AHB AP2 interface which is responsible for access to the debug resources of Cortex-M4 in Vybrid VF61. In case of doubt please refer to the Vybrid Reference Manual, chapter 20: Debug Architecture. Then compile OpenOCD as described in the documentation.
In the next step we need to create a new script for Cortex-M4 on VF61. This script is shown below:
#
# Freescale Vybrid VF610
#

if { [info exists CHIPNAME] } {
        set _CHIPNAME $CHIPNAME
} else {
        set _CHIPNAME vf61
}

if { [info exists JTAG_TAPID] } {
        set _JTAG_TAPID $JTAG_TAPID
} else {
        set _JTAG_TAPID 0x4BA00477
}

if { [info exists A5_SWD_TAPID] } {
        set _SWD_TAPID $SWD_TAPID
} else {
        set _SWD_TAPID 0x3BA02477
}

if { [using_jtag] } {
        set TAPID $_JTAG_TAPID
} else {
        set TAPID $_SWD_TAPID
}

source [find target/swj-dp.tcl]
jtag newtap $_CHIPNAME cpu0 -irlen 4 -expected-id $TAPID

set _TARGETNAME $_CHIPNAME.cpu0
target create $_TARGETNAME cortex_m -chain-position $_CHIPNAME.cpu0

reset_config trst_and_srst
adapter_khz 1000
init
We can save the script mentioned above in any location e.g. OpenOCD home: /usr/share/openocd/scripts/target/vybrid_vf61_m4.cfg
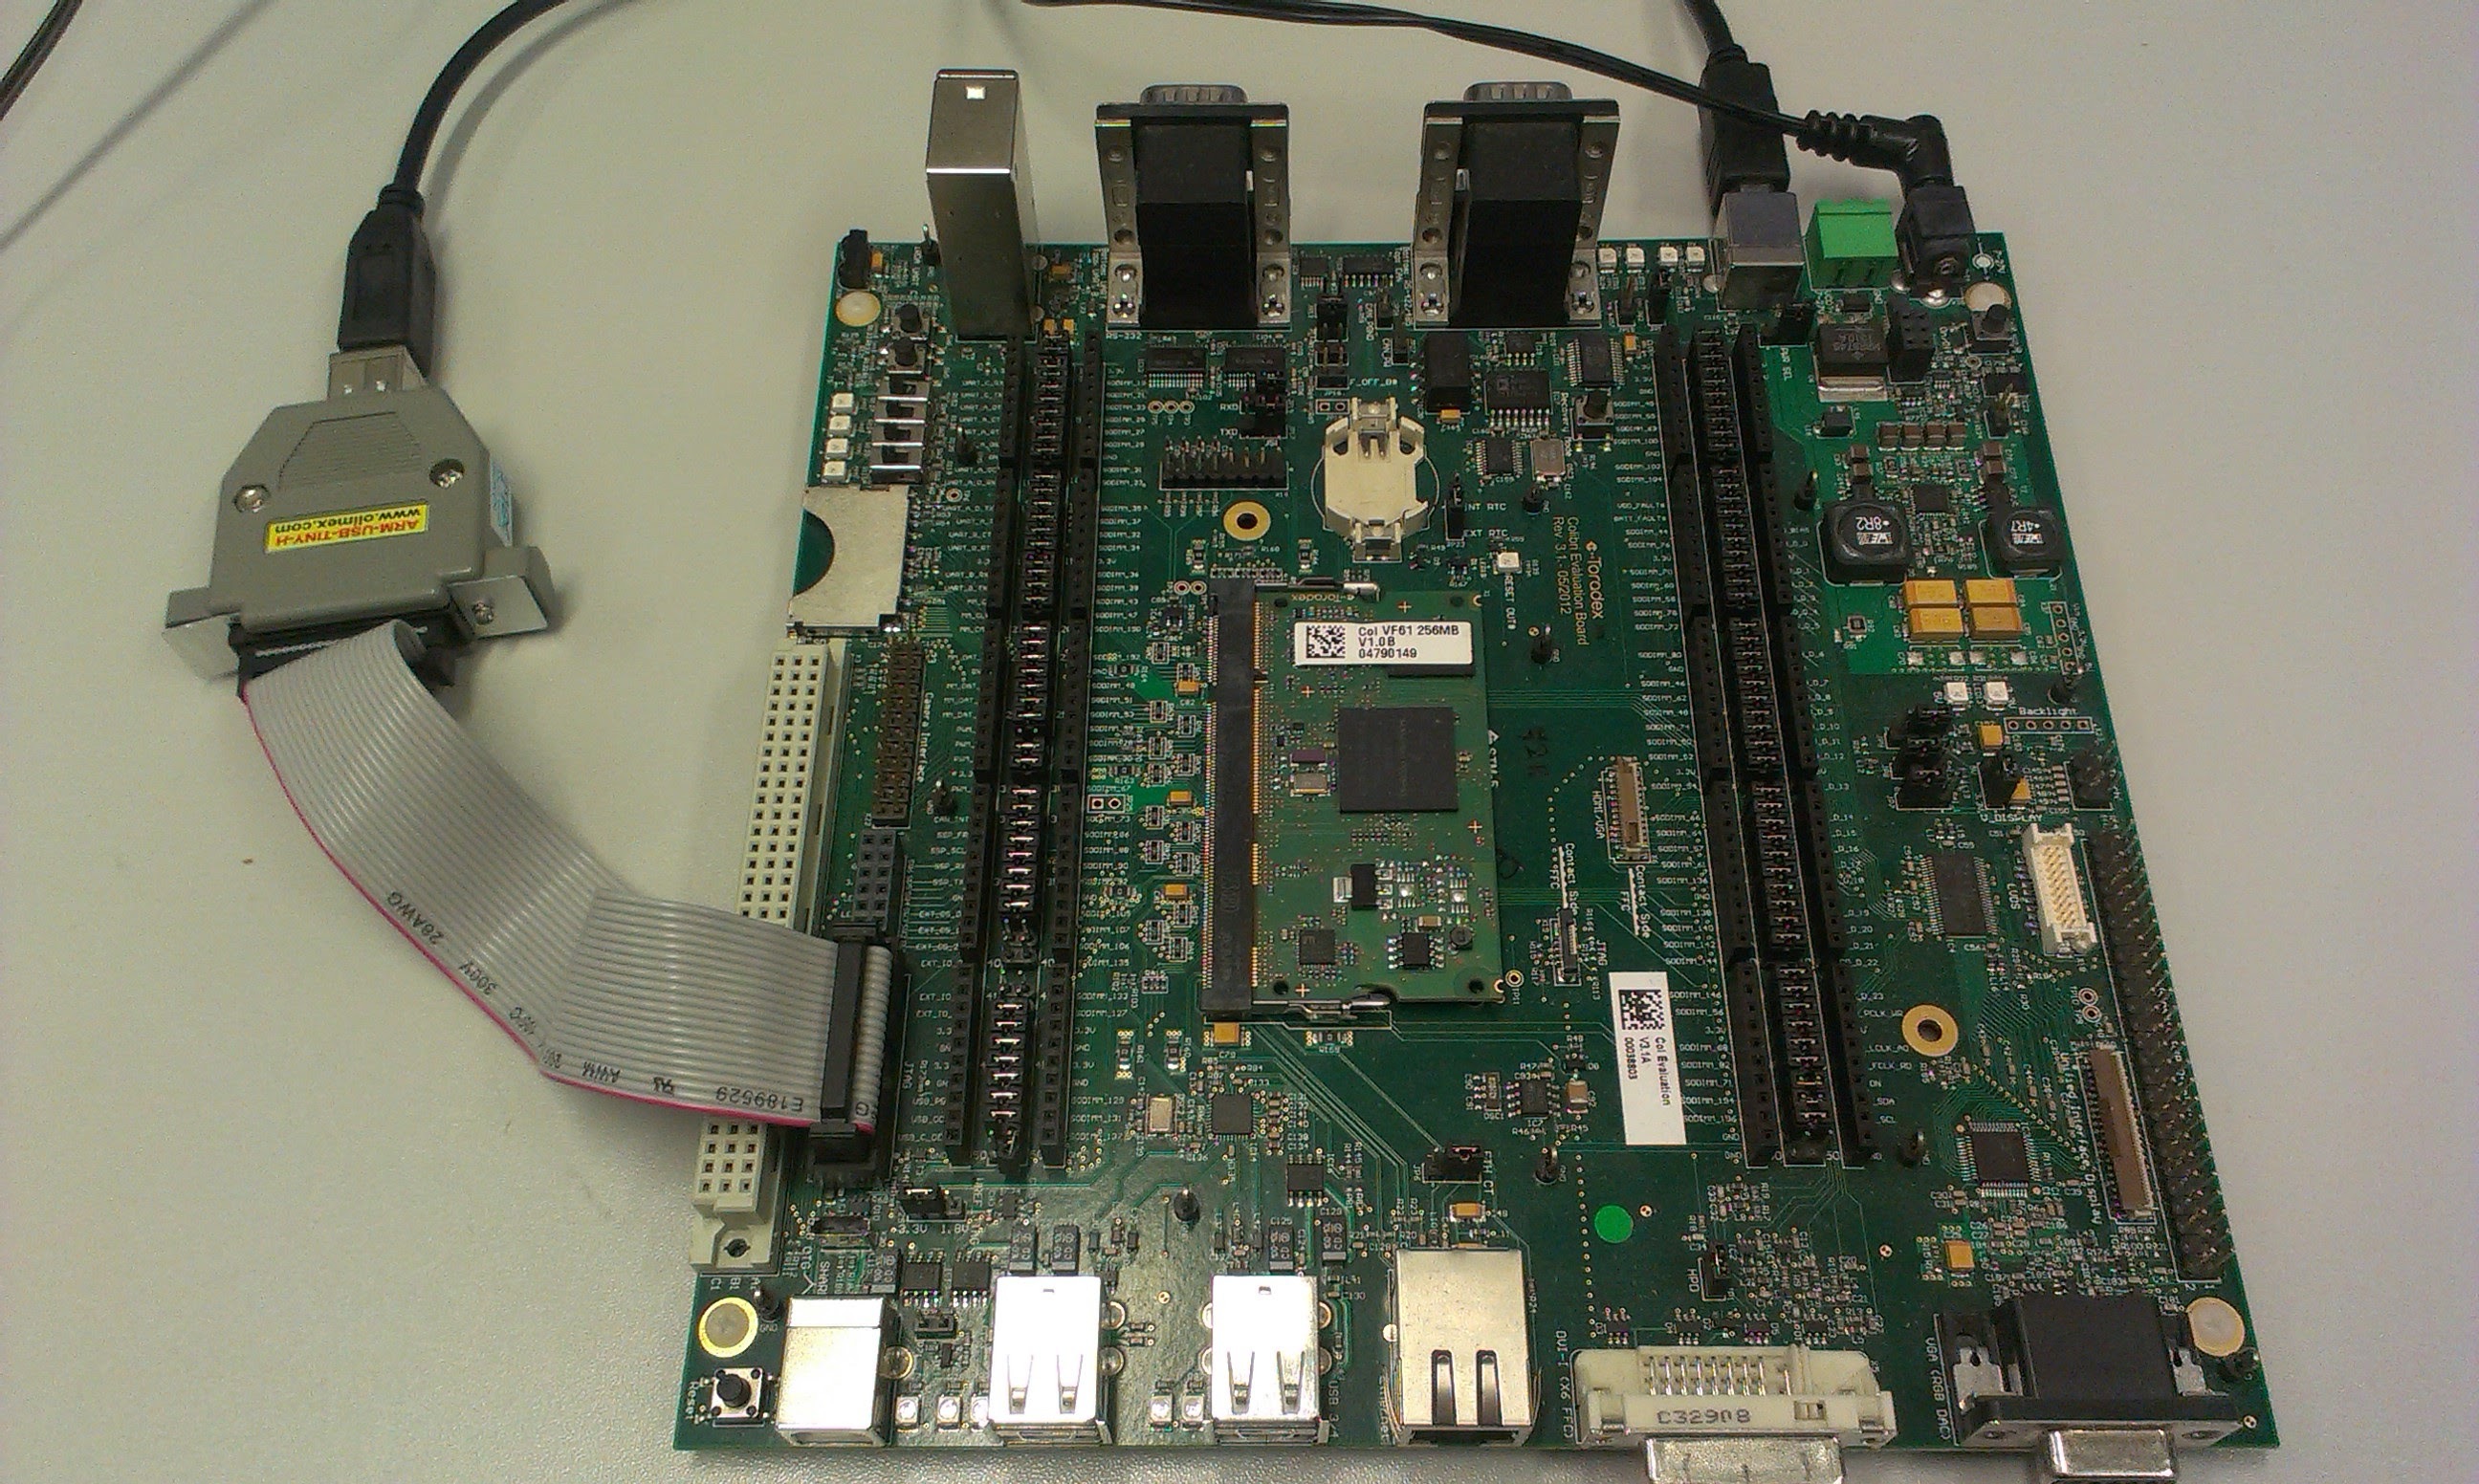
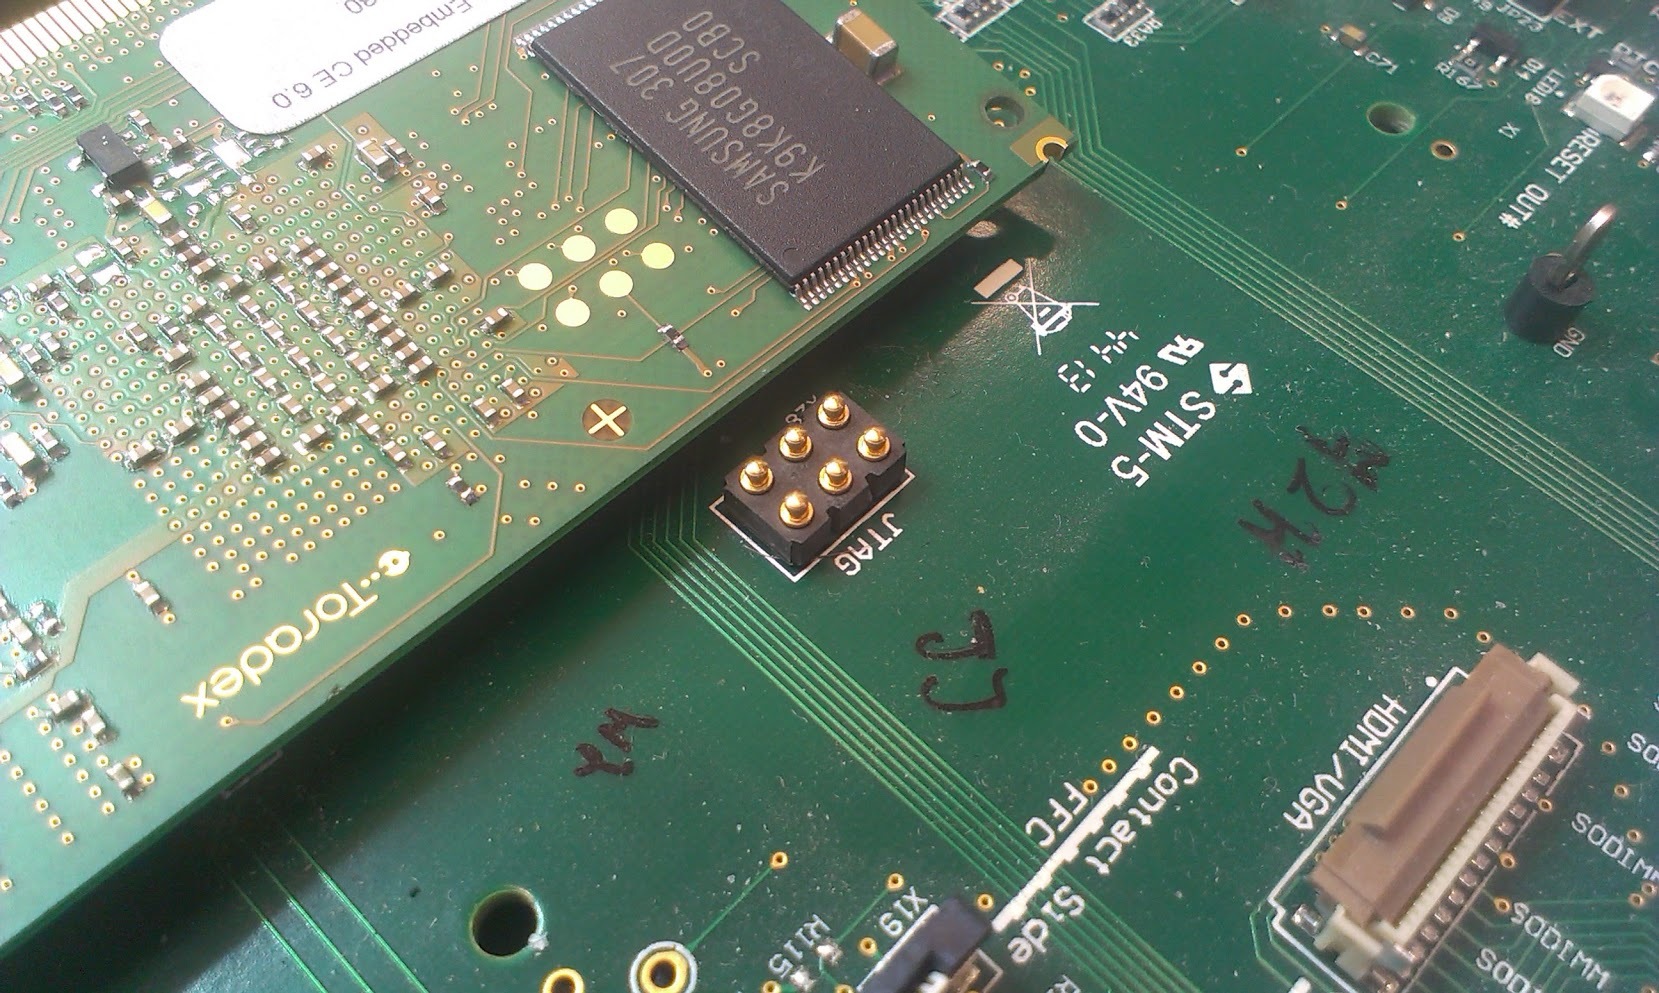
The next step is to connect the JTAG cable to our platform.
Be careful! The JTAG interface is connected with the VF61 module by a flexible connector located under the module (look at the picture on the right side)! Make sure that this connection is solid. If needed, mount the module with screws.
Picture above shows the connection to Toradex Colibri Evaluation Board.
We assume that you have a Toradex Vybrid VF61 module with U-Boot installed. Then everything is pretty straightforward.
Start the Evaluation Board and stop U-Boot by pressing any key after power on.
From U-Boot command line, start the Cortex-M4 core:
mw.l 0x4006b08c 0x00015a5a
Run OpenOCD on your PC with proper scripts for JTAG and Cortex-M4 (replace olimex-arm-usb-tiny-h.cfg with a script for your JTAG):
openocd -f /usr/share/openocd/scripts/interface/olimex-arm-usb-tiny-h.cfg -f /usr/share/openocd/scripts/target/vybrid_vf61_m4.cfg
If you see errors like:
Error: JTAG scan chain interrogation failed: all zeroes
Error: Check JTAG interface, timings, target power, etc.
Error: Trying to use configured scan chain anyway...
Error: vf61.cpu0: IR capture error; saw 0x00 not 0x01
It means that your connection between the module and the Eval Board is wrong, try to correct it.
Start GDB and load your application.
arm-eabi-gdb
(gdb) target remote :3333
(gdb) monitor reset init
(gdb) file your_application.elf
(gdb) load
That’s all! You can now debug your application.
During the debug process you must be aware of a few issues:
If you start Linux from U-Boot, the debug session will be broken. It is related to the configuration of peripherals included in the Linux kernel.
If you want to restart the application on the M4 core, you need to restart your platform and perform all the steps mentioned above once again.