A few months back we introduced girdl, Antmicro’s plugin for the Ghidra software analysis framework, developed to simplify the analysis of the platform register layout using files such as RDLs, SVDs, and Renode model analyzer output. Girdl automatically detects accesses to peripherals and their registers in the decompiled code, providing information about the binding of individual registers and their layouts.
Since then, we’ve been extending girdl with new features, recently focusing on adding support for exporting the data from girdl and Ghidra into a debugger such as GDB. Girdl can now export not only the peripherals it itself has loaded, but also additional data extracted by Ghidra. That makes it possible to use the information generated in Ghidra when debugging actual applications, both on Linux and remote embedded devices.
In this article we describe the implementation and show you how to export girdl and Ghidra data into a debugger, using GDB as an example.

Generating debugging information
Ghidra provides many features for software analysis but if you want to run your software and see how it operates, you need a debugger. However, if you don’t have the symbols or debug information, the debugging process can be very tedious and slow, as you need to go step-by-step through the assembly.
To solve this issue, Antmicro added an option to export not only the peripherals girdl itself has loaded, but also a lot of other data created by Ghidra, such as:
- Data Types
- Global Variables
- Generated Source Code
- Function Parameters and Local Variables
This is achieved by generating an ELF object file with embedded debug information in the standardized DWARF format, which can then be loaded into an already running instance of gdb with add-symbol-file.
Exporting data from girdl and Ghidra into GDB
If you’re debugging without symbols, all you have access to is the raw disassembly. This could be sufficient for debugging small programs or small sections of a program, but for anything bigger or more complex, it becomes impractical.
(gdb) br *0x5555555551b0
Breakpoint 1 at 0x5555555551b0
(gdb) run
Starting program: /home/ant/Documents/test/sdebug3
[Thread debugging using libthread_db enabled]
Using host libthread_db library "/lib/x86_64-linux-gnu/libthread_db.so.1".

Breakpoint 1, 0x00005555555551b0 in ?? ()
(gdb) x /10i $pc
=> 0x5555555551b0:	mov    %edi,%eax
   0x5555555551b2:	xor    %edx,%edx
   0x5555555551b4:	push   %rbx
   0x5555555551b5:	imul   %esi,%eax
   0x5555555551b8:	add    %edi,%eax
   0x5555555551ba:	cmp    %eax,%edi
   0x5555555551bc:	setl   %dl
   0x5555555551bf:	add    %edi,%edi
   0x5555555551c1:	cmp    %esi,%edx
   0x5555555551c3:	cmovne %edi,%esi
(gdb)
In comparison, if you have access to symbols generated by Ghidra and exported with girdl, for the same executable as shown above and at the same address, you can see the function definitions and their call parameters.
Breakpoint 1, foo (a=1, b=4) at ./atest.dwarf.c:98
98
(gdb) list
93
94	// Decompiled from address 0x1011b0
95	void foo(int a,uint b)
96	{
97	    uint uVar1;
98
99	    uVar1 = a * b + a;
100	    if (a < (int)uVar1 != b) {
101	        b = a * 2;
102	    }
(gdb) n
99	    uVar1 = a * b + a;
(gdb) n
100	    if (a < (int)uVar1 != b) {
(gdb) p uVar1
$2 = 5
(gdb)
To prevent users from using potentially invalid variable/parameter values that may not accurately reflect the generated source code, girdl will try to mark the clobbered variables as <optimized out> (as shown below).
Breakpoint 1, foo (a=1, b=4) at ./atest.dwarf.c:98
98
(gdb) list
93
94	// Decompiled from address 0x1011b0
95	void foo(int a,uint b)
96	{
97	    uint uVar1;
98
99	    uVar1 = a * b + a;
100	    if (a < (int)uVar1 != b) {
101	        b = a * 2;
102	    }
(gdb) n
99	    uVar1 = a * b + a;
(gdb) n
100	    if (a < (int)uVar1 != b) {
(gdb) p uVar1
$2 = 5
(gdb) p a
$3 = <optimized out>
(gdb) p b
$4 = 4
(gdb)
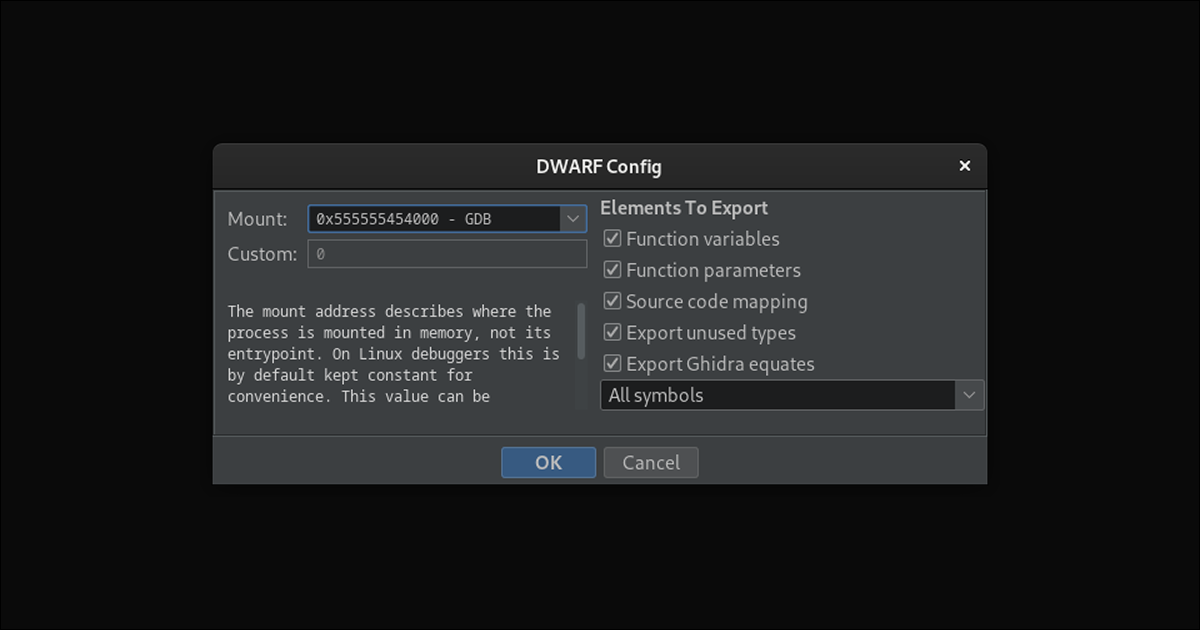
To export a DWARF symbol file, select File > Export to DWARF... from the menu bar. After selecting the target location, you can choose which components to export. By default, all the data available in girdl will be exported.
You can now also run girdl outside of Ghidra, using the new standalone mode. This mode allows you to export peripheral information to DWARF debug files without starting Ghidra; however, the exported file will contain only the peripherals and nothing else. The exported DWARF file can then be loaded into GDB the exact same way as the one created with Ghidra, using the add-symbol-file command.
Improved analysis and debugging with girdl
The girdl plugin simplifies the process of analyzing binaries. With the developments described in this article, you can now export the information generated by both girdl and Ghidra into a debugger, gaining even more insight into your software.
If you’re interested in learning more about Antmicro’s services or would like to discuss your specific project, don’t hesitate to contact us at contact@antmicro.com.