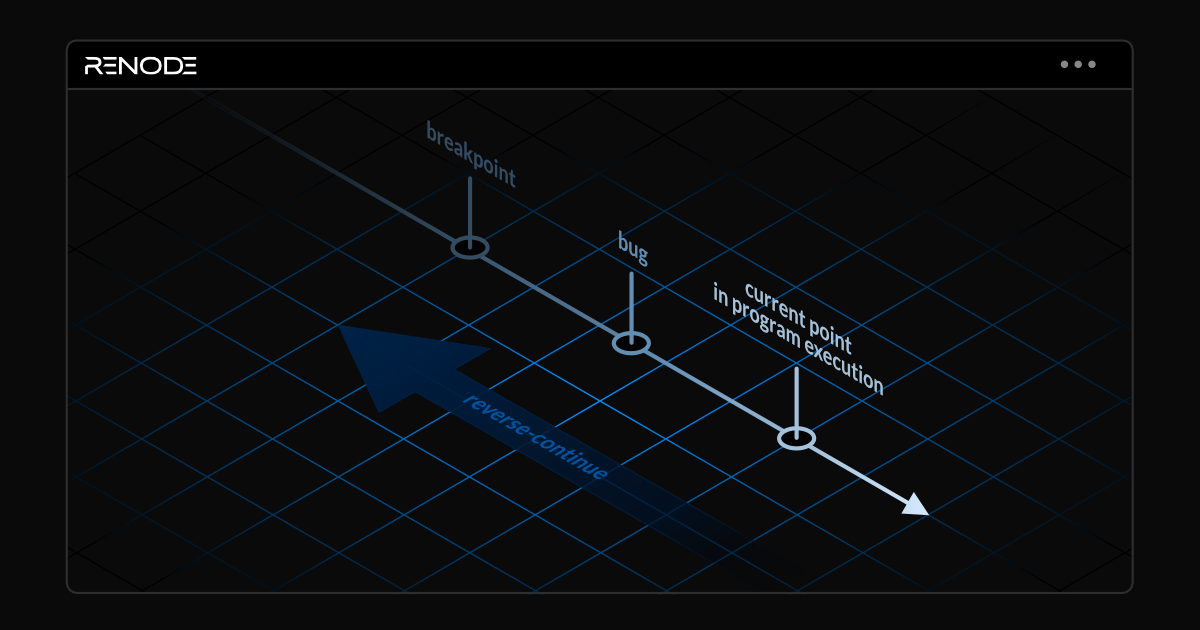
When debugging software, if you step over the code past your region of interest, usually you need to restart the whole process, which takes time. However, by recording the execution of a program and then “rewinding” and “replaying” it, you can go back to the point just before the bug you’re analyzing occurred, examine the code, and identify the cause of the bug. This approach, called reverse execution, makes debugging easier and more accurate, as you can focus on a specific piece of code and go backwards and forwards as many times as necessary.
Antmicro’s Renode simulation framework offers advanced debugging capabilities through integration with GDB, which allows you to use the most common GDB functions, such as breakpoints, watchpoints, stepping, and memory access. GDB also provides support for reverse execution, though it typically doesn’t present this option to the user - instead, the target GDB connects to can declare which debugging features are supported.
We have recently introduced support for reverse execution in Renode for single core machines. Unlike working with physical hardware, in Renode you can now go back in (virtual) time, making the framework even more useful when debugging complex software. In this article we will walk you through the process of implementing reverse execution in Renode and show how it can be used for backwards debugging.
Implementing reverse execution in Renode
Support for reverse execution in Renode was enabled by its existing features, including GDB integration and state saving and loading. We leverage Renode’s snapshotting capabilities to take periodic saves of the state of emulation. Then, when the user wants to go back in time, we re-run the snapshots from latest to earliest, while searching for breakpoints which the user wants to jump back to, then resume the emulation from the last hit point. The reverse execution mechanism is available for all platforms that can be serialized into a snapshot.
Currently, the following commands are available in Renode:
reverse-step(rs) - reverse-execute one instruction,reverse-stepi(rsi) - reverse-execute one assembly instruction,reverse-continue(rc) - return to the last breakpoint, or to the first snapshot if no breakpoints were set before.
For more information about reverse execution in Renode, refer to the documentation.
Reverse execution supports sharing snapshots, allowing developers to share the emulation states with others, saving time normally required for setting up the simulation environment. The automatically generated snapshots can be shared in the same way you can transfer states created by executing Save in the Monitor - without any additional binaries or configuration files required to recreate the original setup.
Currently, Renode supports rewinding shared snapshots only when they are placed in the same path as when they were originally created. To do that, use the autoSave true @/tmp/renode_share false command to enable autosaving (true), specify the target directory that can be reflected in other systems (in this case @/tmp/renode_share) and disable per PID subdirectory creation (false).
Reverse debugging in Renode: demo
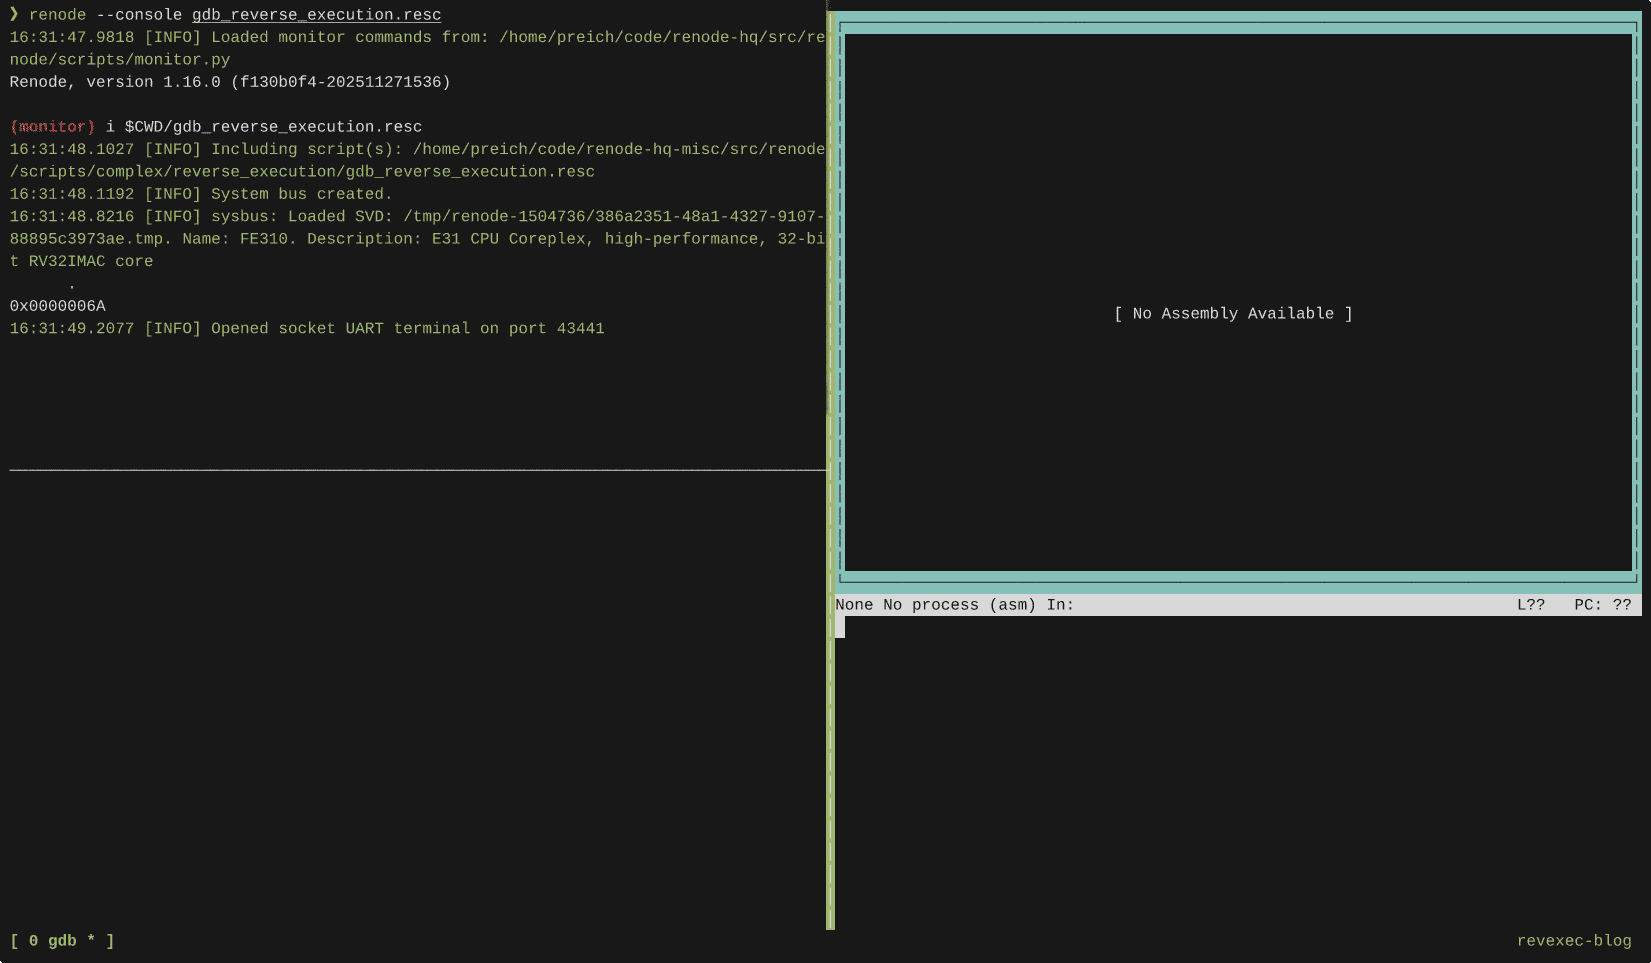
To showcase the reverse execution feature in Renode, we prepared a demo that loads a single-core RISC-V machine and turns on preset settings for reverse execution using the reverseExecMode true command. This will automatically enable snapshotting every 200 milliseconds, which you can adjust manually by issuing the autoSave command (see the Autosaving section in the documentation for more details).
To start the demo in Renode, run:
renode scripts/complex/reverse_execution/gdb_reverse_execution.rescThen, use the provided GDB script to connect GDB to Renode, show the assembly window, and set breakpoints in crucial places:
gdb -x scripts/complex/reverse_execution/script.gdbAs you continue with the demo, you’ll notice :( printed on the UART console when you get to the third breakpoint, which means that a check has failed. Use the reverse-continue command to go back to the second breakpoint. Here you can step back through instructions by issuing rsi. The beq t3, t4, ok test at 0x80000014 checks if the t4 register is set to 0x1337. Set the t4 register to 0x1337 (set $t4=0x1337) and then continue. This time, you’ll see OK printed on UART.
The entire flow is shown below:
Comprehensive debugging with Renode
Thanks to its integration with GDB, Renode offers extensive debugging capabilities, including reverse execution that is especially useful when debugging software with long runtimes, as you don’t have to execute the entire program every time. Combined with other features such as execution tracing, code coverage analysis, and a deterministic testing environment, it makes Renode a perfect choice for an advanced software testing and development framework.
If you’d like to learn more about how Renode can improve your debugging and testing workflows, don’t hesitate to contact us at contact@antmicro.com.


