When developing new or improving existing data processing IP cores, it can be difficult to find which submodules cause bottlenecks in the pipeline and lower the expected performance. Manual analysis of system buses can be time-consuming and error-prone, especially for bigger and more complex designs.
To help automate this process in our internal and customer projects, Antmicro created Busperf, an open source tool that analyzes the performance of the most common buses, including AHB, APB and, AXI, to help identify throughput bottlenecks. Busperf takes VCD or FST files generated by HDL simulators such as Verilator, along with bus descriptions in YAML, then generates statistics on bus activity. Thanks to its integration with the Surfer waveform viewer, Busperf offers a quick option to preview specific places in the waveform where a transaction took longer than usual, which makes the analysis easier.
In this article, we will describe how Busperf works and show how it can help you quickly identify buses with low utilization or high backpressure.

Busperf overview
To perform the analysis, Busperf requires two types of files: a VCD/FST file, containing waveform information, and a YAML bus description that defines properties such as the name of the bus, the scope it can be found in, the type of the bus, and the names of the signals. Currently, Busperf provides analyzers for the AXI, AHB, and APB buses. Busperf also enables extending its functionality through Python plugins to support custom bus protocols. For details about defining the Busperf-plugin interface and your own custom buses, refer to the documentation.
During analysis, Busperf calculates such statistics as the command-to-completion time, number of clock cycles in a given bus state, or delays between transactions. When the calculations are finished, Busperf generates a customizable report showing the results in one of the following formats:
- GUI: a visual form with charts, plots, and tables showing the results.
- Text: a text-based table printed to the console that can be used in CI.
- Data: a binary format that can be opened in Busperf for later analysis.
- Markdownand CSV: statistics data that can be saved to an
.mdor a.csvfile. - HTML: a single HTML file with an embedded WebAssembly (Wasm) version of the Busperf GUI and data from the analysis.
Internally, Busperf connects to the Surfer waveform viewer through the Waveform Control Protocol to automatically load required signals or mark points of interest. It also uses the wellen library for VCD/FST loading and the egui GUI library for visualization.
Busperf analysis results
With the waveform file and YAML description ready, starting the analysis with Busperf is as simple as running the following command:
busperf analyze --text /path/to/the/waveform/file.fst /path/to/the/yaml/file.yamlAn example of a YAML bus description is shown below. For more examples with different types of buses, refer to the documentation.
interfaces:
  ram_rd:
    scope: [test_taxi_axi_ram, uut]
    clock: clk
    reset: rst
    reset_type: high

    custom_analyzer: AXIRdAnalyzer
    ar:
      id: [s_axi_rd, arid]
      ready: [s_axi_rd, arready]
      valid: [s_axi_rd, arvalid]
    r:
      id: [s_axi_rd, rid]
      ready: [s_axi_rd, rready]
      valid: [s_axi_rd, rvalid]
      resp: [s_axi_rd, rresp]
      last: [s_axi_rd, rlast]

  ram_wr:
    scope: [test_taxi_axi_ram, uut]
    clock: clk
    reset: rst
    reset_type: high

    custom_analyzer: AXIWrAnalyzer
    aw:
      id: [s_axi_rd, awid]
      ready: [s_axi_wr, awready]
      valid: [s_axi_wr, awvalid]
    w:
      ready: [s_axi_wr, wready]
      valid: [s_axi_wr, wvalid]
      last: [s_axi_wr, wlast]
    b:
      ready: [s_axi_wr, bready]
      valid: [s_axi_wr, bvalid]
      resp: [s_axi_wr, bresp]
      id: [s_axi_wr, bid]
Busperf defines two main types of analyzers: single-channel and multichannel. Single-channel analyzers are dedicated for simpler buses, such as AXI-streams, APB, AHB, or WishBone, while multichannel analyzers are used for high performance buses with separate channels for request and response, such as AXI4.
Single-channel analysis
Single-channel analysis can be divided into two categories: bus utilization and state, and transaction behavior. For the bus utilization and the state, Busperf gathers the following statistics:
Resettime spent in the reset state.Freetime spent with the bus being inactive.Busystate, in which the bus is actively transferring data.Backpressurestate, in which the bus isn’t allowed to transfer databecause a receiver isn’t ready.No datastate, which is directly opposite toBackpressure, that is, a receiver is ready for the data, but a transmitter is not.No transaction, which is similar toBackpressure, with the difference that it’s used for credit-based buses and reflects the time a transmitter spent without credits.
For the transaction behavior, Busperf gathers the following information:
Transaction delays: the time spent between a bus handshake and the next bus request.Burst lengths: the number of consecutive handshakes on the bus.
These statistics differ from the previous group as they’re grouped in buckets, instead of being accumulated.
Multichannel analysis
Multichannel analyzers focus on channel-to-channel interactions and higher-level analysis, including bandwidth, an error rate, or command to completion. These statistics can also be split into two categories: transaction behavior, and bus throughput and the error rate.
For the transaction behavior, Busperf gathers the following statistics:
Command to completion: counts how many cycles it took for the entire command, e.g. a read or a write request, to be processed by the system.Command to first data: indicates how long it takes for the transaction data to be available. In the case of read transactions, this indicates the time between accepting a read request and the first data to arrive. For write requests, it indicates the time from sending a write request to providing data for it.Last data to completion: provides insight into the time required by the system to process a request after data have arrived. In most cases, the read transactions contain completion information in the last data burst, so the value is 0. However, the write transactions provide this information through a separate response packet.Transaction delays: a number of cycles between receiving a response to the last request and issuing a new one. In systems that allow for multiple outstanding transactions at a time, this value can be negative, which means that a new transaction has been requested while waiting for the previous one to finish.
For the throughput and error group, Busperf analyzes the following information:
Bandwidth, which is the average number of transactions in a clock cycle throughout the simulation.Bandwidth aboveandBandwidth below, which represent the percentage of the simulation time spent above or below a given bandwidth threshold.Error rate, which is a percentage representation of the failed transfers out of all the transfers done on the bus.
You can connect multiple analyzers to the same bus if you want to perform multichannel and single-channel analyses at the same time. This is useful to track both the AXI4 bandwidth and data channel status to pinpoint which part of the bus is causing slowdowns.
Analyzing an AXI SRAM module
Below, you can see an interactive example of Busperf’s output for a simple AXI SRAM module:
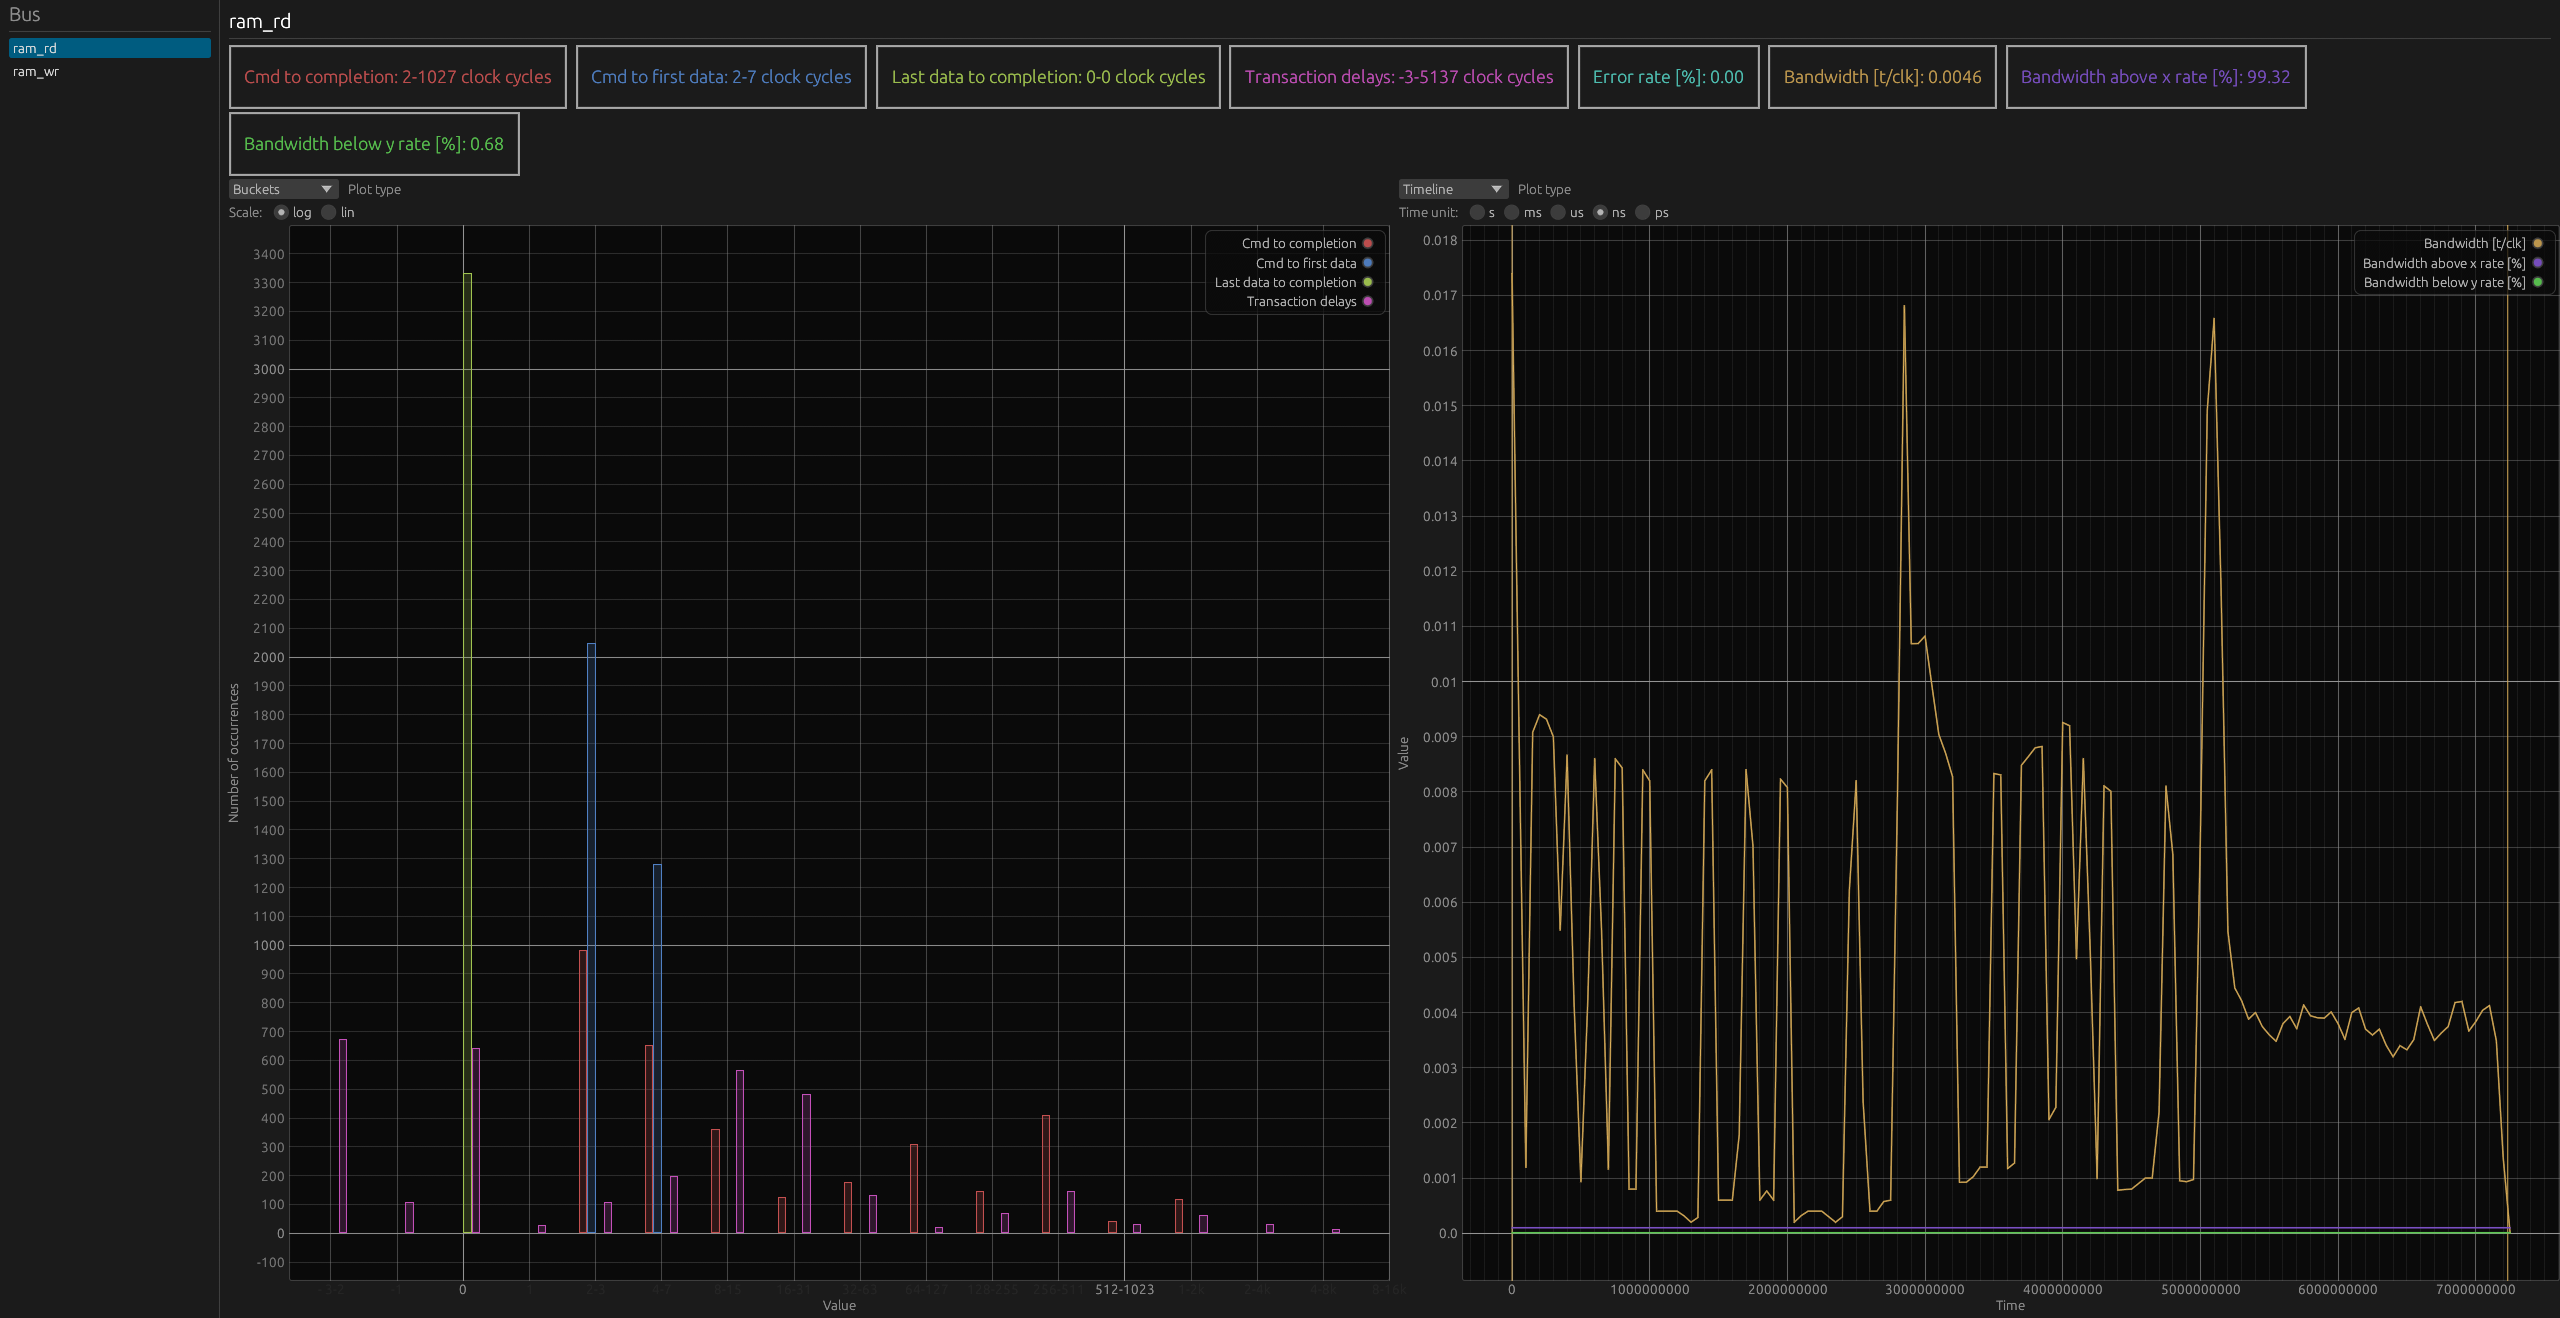
(For an interactive version of the diagram, visit the desktop version of the website.)
In this example, there are two mutlichannel analyzers, ram_rd and ram_wr. The first one tracks AXI read requests, and the second one AXI writes. Since the bandwidth for ram_rd is smaller than the one for ram_wr, let’s extend the analysis to the address and data channels in the single-channel modes.
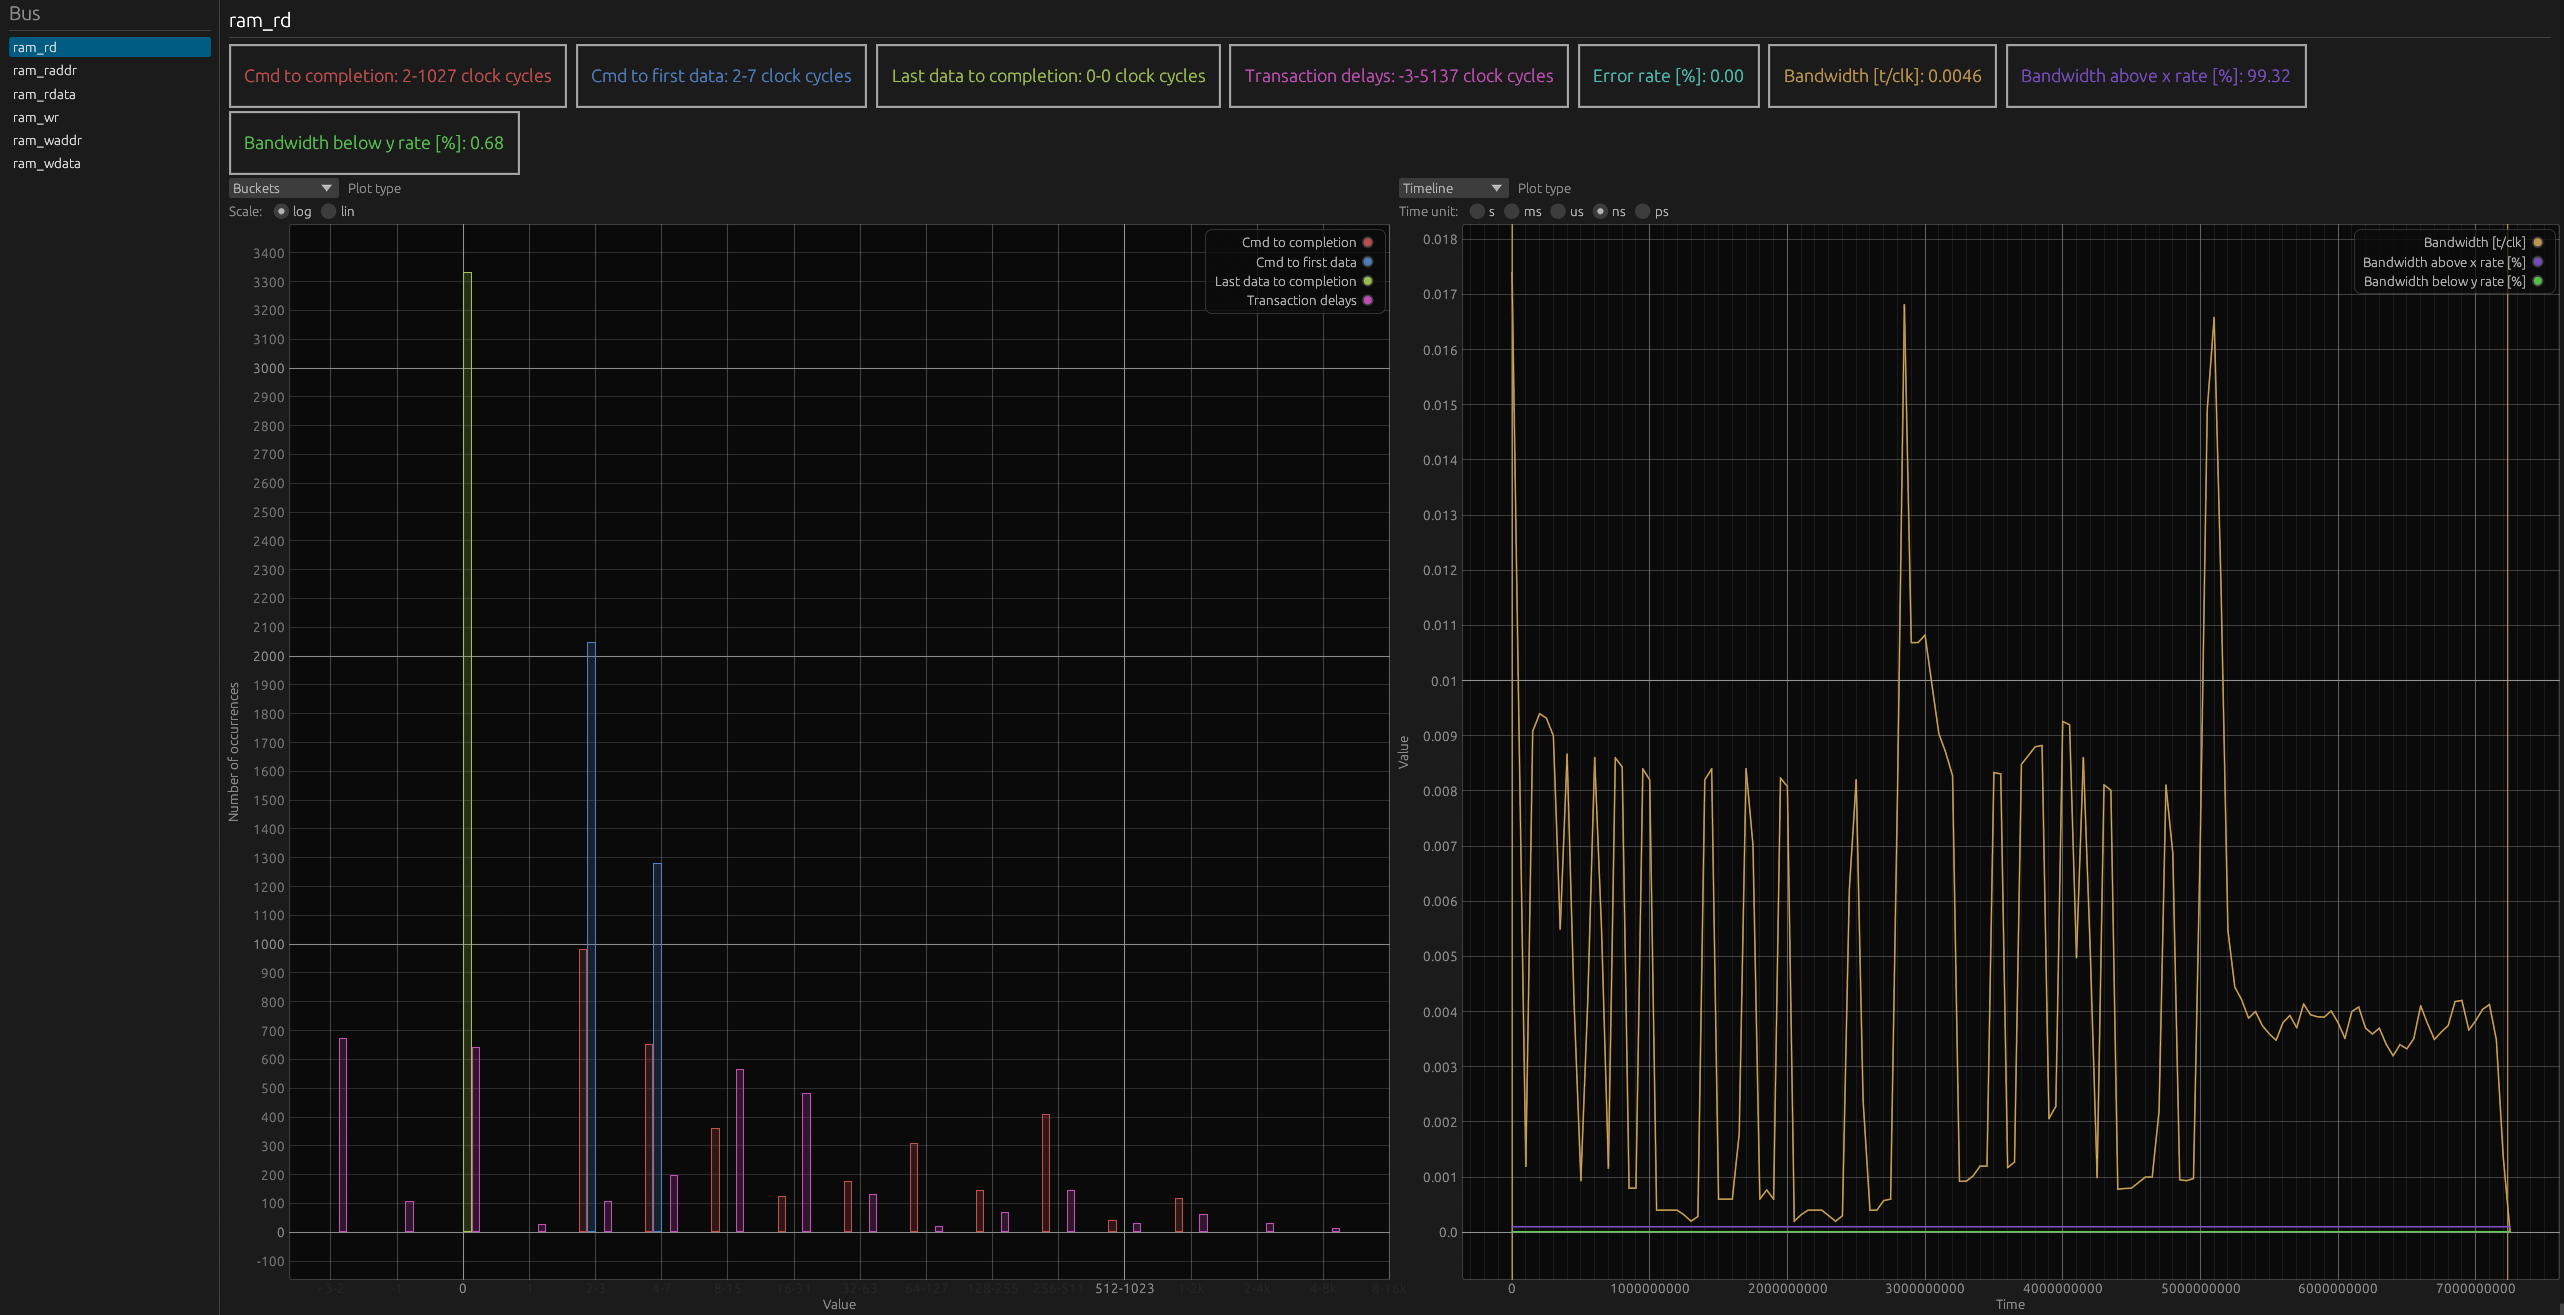
(For an interactive version of the diagram, visit the desktop version of the website.)
This time, four new busses were added: ram_raddr, ram_rdata, ram_waddr, and ram_wdata. The analysis of the ram_waddr address channel shows that the address bus is underutilized, with almost no backpressure. Looking at ram_wdata also proves that the data write channel isn’t bottlenecking the bus performance, as the bus is mostly in idle states, with minimal backpressure.
On the other hand, on the ram_raddr read address channel, the backpressure constitutes around 1/3 of the entire bus time. The ram_rdata read data and response channel show similar behavior, as around a quarter of the bus time is taken by backpressure.
This analysis points to performance issues in the read path, specifically with the AXI SRAM read address processing and the interconnect read response handling.
Accelerating bus performance analysis with Busperf
With Busperf, you can quickly turn simulation traces into actionable insights. If you work with complex pipelines, debugging performance at the RTL or simulation level, Busperf offers a fast way to identify bus-level throughput bottlenecks, beyond just waveform inspection. You can use various types of Busperf output in documentation or in a CI setup.
Reach out to us at contact@antmicro.com to learn more about Antmicro’s services, or to discuss how we can help you improve your digital design workflows.