Last year, in collaboration with Analog Devices, Inc (ADI), Antmicro introduced Zephelin - a Zephyr Profiling Library enabling the capture and reporting of runtime performance metrics for Zephyr RTOS applications. Zephelin is capable of tracing all functions of an application via Zephyr’s instrumentation system, as well as tracing custom events, the inference of a running AI model (via TFLite and microTVM), CPU usage, memory usage, and readouts of sensors on the device.
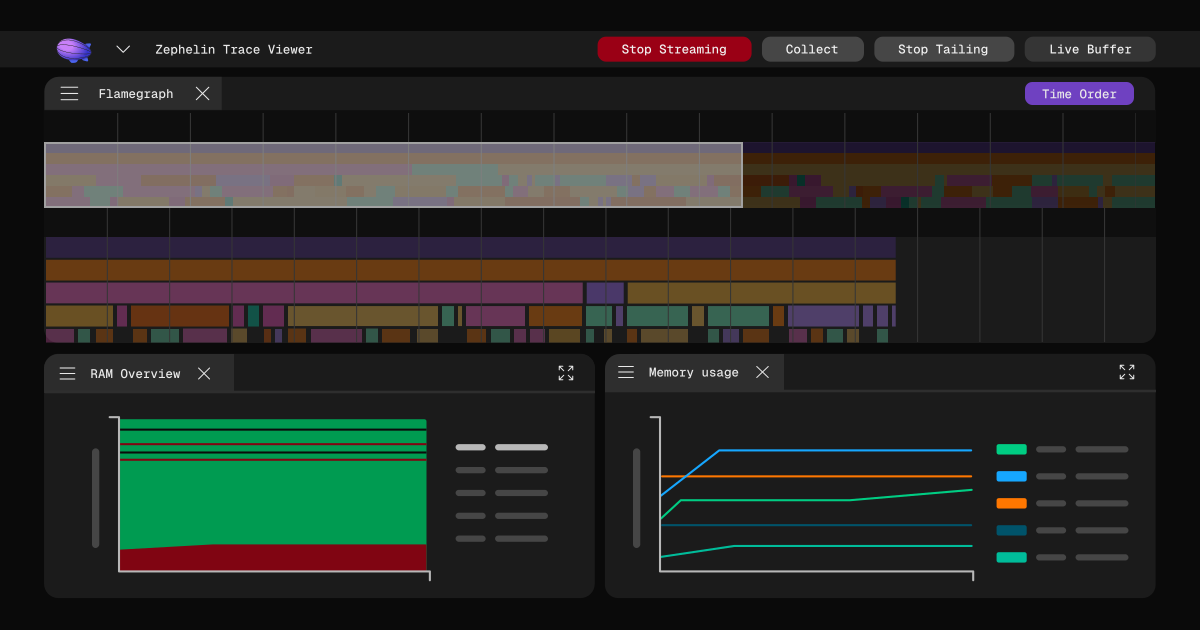
Zephelin’s dedicated web visual interface, Zephelin Trace Viewer, then allows to view and analyze the collected traces - or any traces in Trace Event Format (TEF), for that matter. Trace Viewer displays flamegraphs, which show hierarchical stack trace data, as well as information panels which can contain AI model information, execution time of AI model layers, information on CPU usage, memory usage, sensor readouts, and more.
Together, Zephelin and Trace Viewer can aid developers of embedded systems in optimizing their applications, allowing to track and view performance and spot potential bottlenecks, including tracking the statistics of executed AI models. This knowledge can also be used by developers of AI runtimes and compilers to look for improvements and bottlenecks in AI model execution. With the number of devices running Zephyr growing year by year, searching for optimizations in applications, AI models and AI runtimes is a notable part of developers’ work to support the growth of the Zephyr ecosystem.
Since its first release, we’ve introduced a number of improvements to both Zephelin itself and its Trace Viewer, and we are currently on the 1.0.0 release of the Zephelin library! This article describes the upgrades and new features which are part of this release, including live analysis of applications running on the device, support for multi-threaded applications, delivering tracing and instrumentation traces over a single backend and more.
Analyzing traces live from the board
The major feature of the 1.0.0 release is the introduction of live tracing, which enables you to visualize the traces an application produces as they’re being generated in real time. This allows for unique interactivity with your application, such as giving you the option to observe how certain inputs (reaction of sensors or pressing buttons) influence the performance of your program and receive immediate feedback.
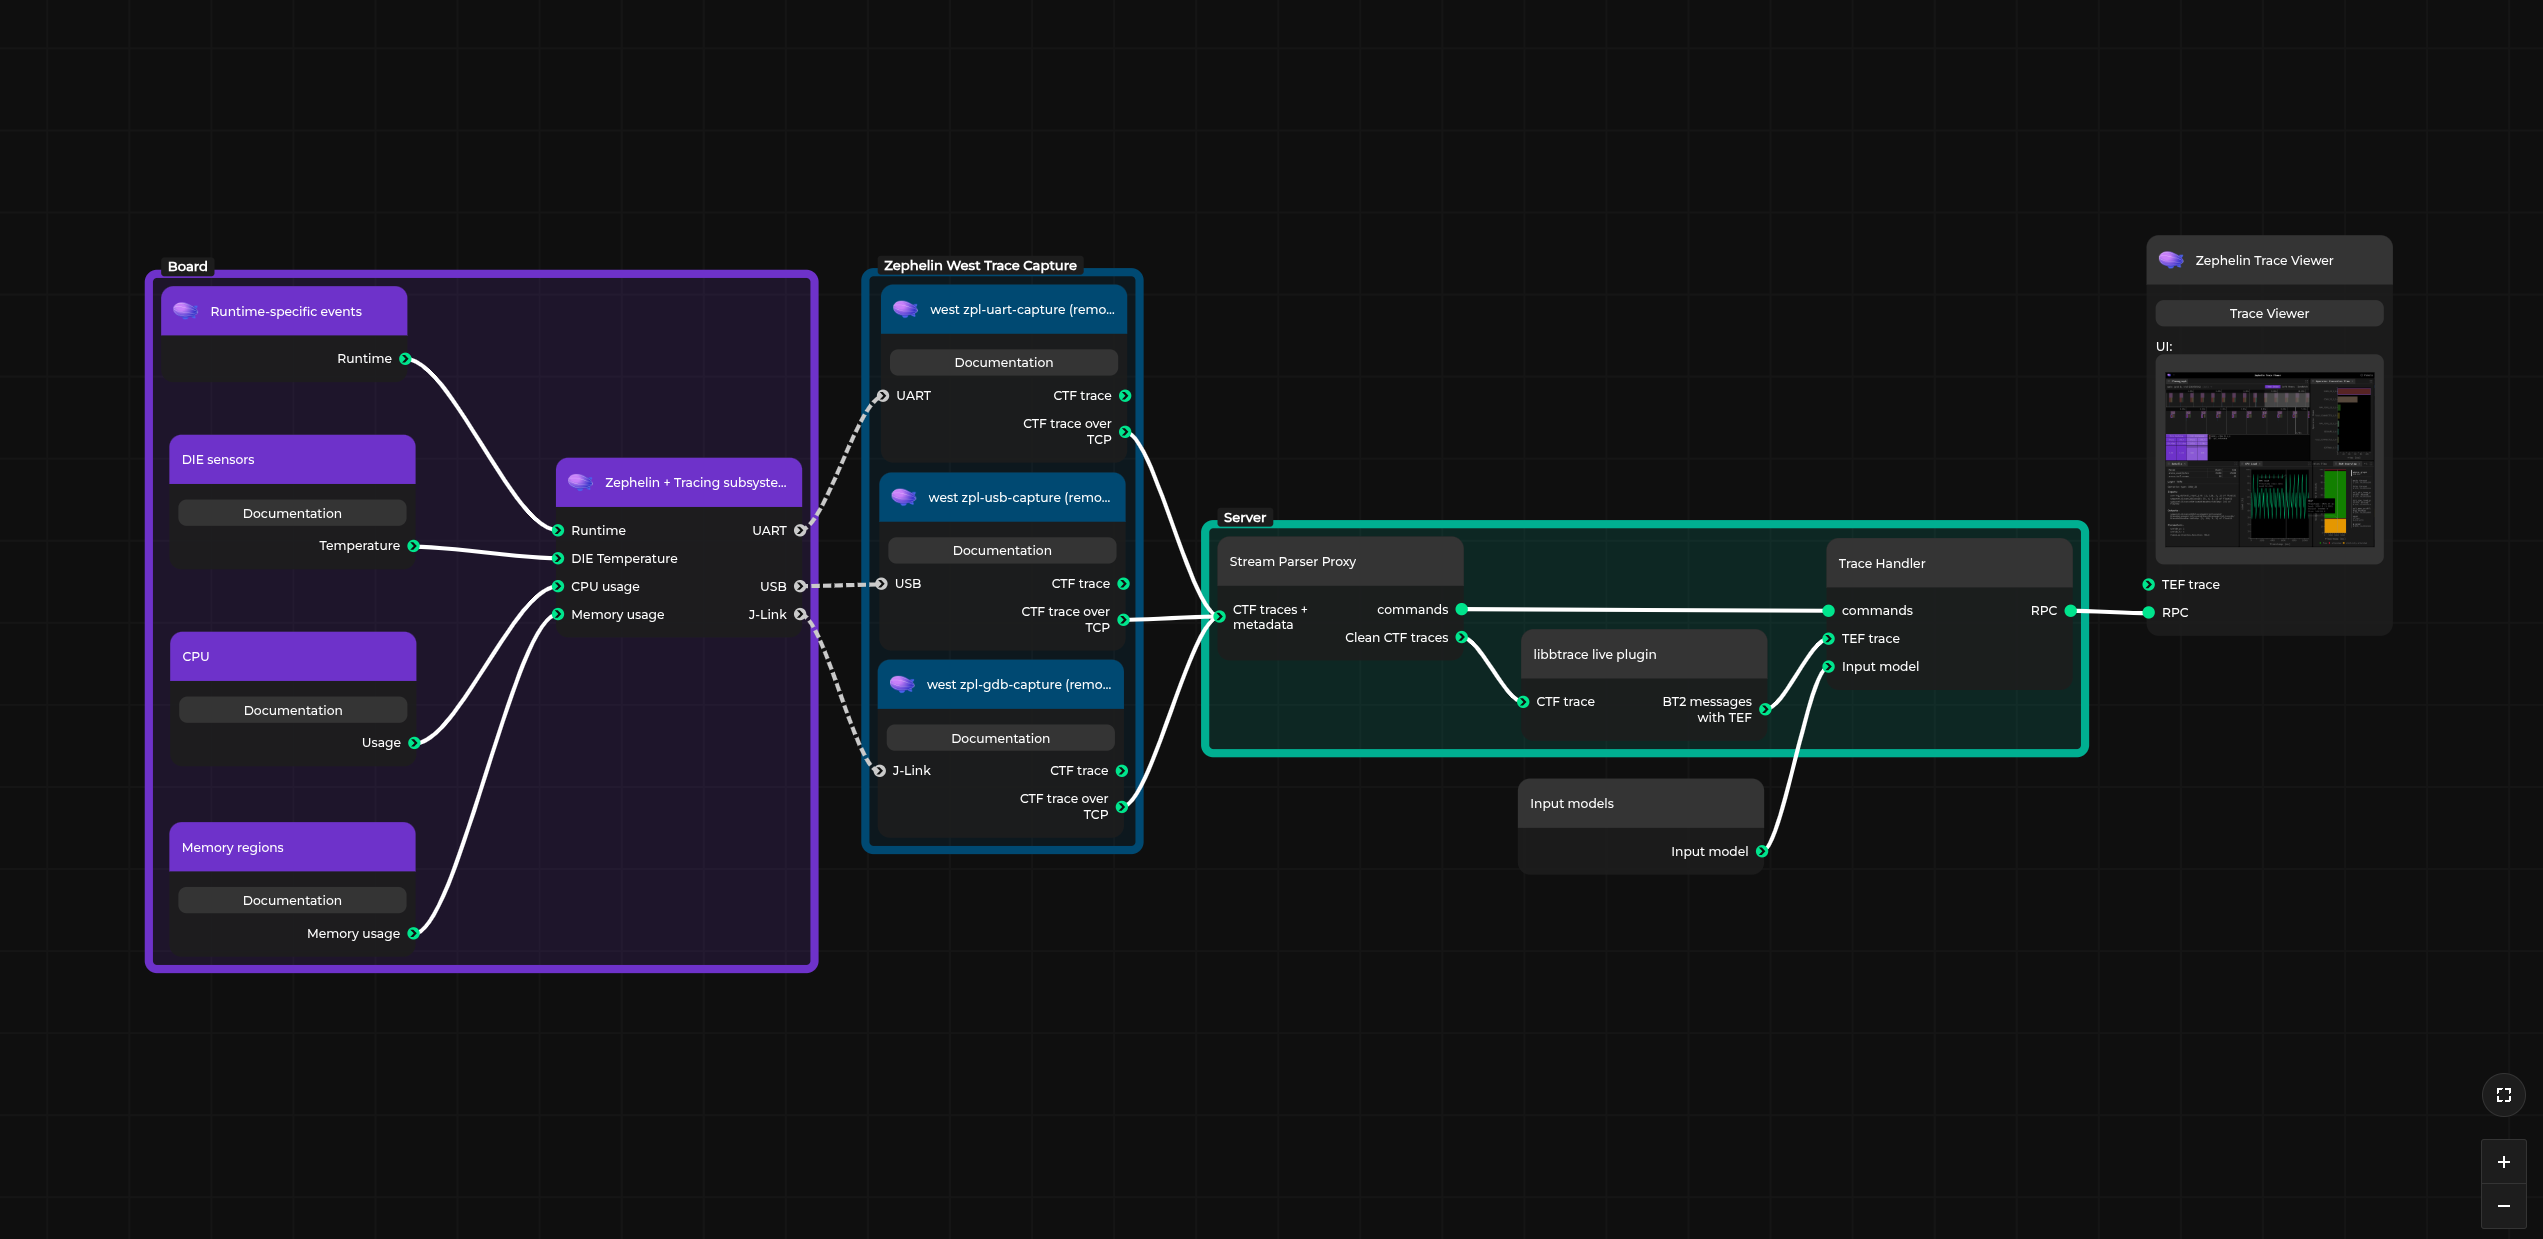 To view an interactive version of the diagram, visit the desktop version of the website.
 The interactive block diagram above demonstrates the live tracing flow. Traces which are gathered from the application are pushed to one of the available backends (UART, USB, or GDB). This data is captured by a capture script, and forwarded to a socket opened by the backend. The socket is connected to a proxy, which then sanitizes the data and separates it into discrete events. Additionally, the proxy handles other signals coming from the board, such as reset command for the GUI (due to start of another session).
Once the data is cleaned, a network socket passes it to libbtrace, which is the library responsible for the conversion of collected traces, since Zephyr produces traces in CTF, while Trace Viewer supports TEF. After conversion, the traces, now in TEF, are sent to the Trace Viewer backend, which streams the data to the frontend, where it’s used to build flamegraphs and info panels.
The video above shows what live tracing looks like in Zephelin Trace Viewer. You can see traces being collected and displayed; we also show two additional information panels: RAM overview on the left, and memory usage on the right.
In order to learn more about the live tracing feature, including server dependencies, how to run and configure the Zephelin server and more, refer to the relevant chapter of the documentation.
You can find details on how to run live tracing in the example of the TensorFlow Lite Micro inference.
Adding support for the Tracing Subsystem in the Instrumentation Subsystem
Previously, the Instrumentation Subsystem had separate delivery of trace data, meaning it could only be sent over an UART connection. As such, in order to collect instrumentation and tracing data coming from Zephelin, two connectors were required (e.g. UART for instrumentation and GDB for tracing).
We’ve now modified the Instrumentation Subsystem and given it the ability to use the Tracing Subsystem to deliver traces using its supported backends (UART, GDB or USB). This allows sending both data introduced to the Tracing Subsystem (custom events, resource usage, model data) and instrumentation data using a single channel. It also enables using faster backends for instrumentation as a side benefit.
The example on how to use the Instrumentation Subsystem through the Tracing Subsystem can be found in one of the Zephelin demos.
Those changes pair well with the live tracing support, allowing to collect instrumentation data and display execution on the screen.
Better support for applications running on multiple threads and SoCs
Zephelin Trace Viewer has also had a significant addition - namely, we’ve introduced support for displaying multiple flamegraphs in the Trace Viewer. This allows us to display:
- Traces from individual threads side-by-side, allowing analysis of multithreaded applications;
- Traces from different runs of a modified application, allowing to see improvements or regressions in performance;
- Traces from different applications running in heterogeneous systems with multiple SoCs.
Not only does it extend the flexibility in terms of viewing customization, but it makes the process of analyzing and monitoring applications much easier, now being able to open two traces or info panels of the same time and place them side by side without needing to switch.
This new feature introduced the need to provide visual clarity when tracking and monitoring applications running neural networks (NNs), as, in such cases, the visual layout may quickly become confusing or hard to navigate. To prevent that and ensure a legible and comfortable viewing experience, when multiple panels are open, clicking on a given bar placed in an info panel will automatically take you to the flamegraph tied to it. Moreover, we implemented color hinting; when working with multiple flamegraphs, the colors of bars in info panels will correspond to the graph it’s tied to. And if the flamegraph for a given info panel is not currently displayed, the bars on its corresponding panel will turn one color, instead (like the green bars in the OP Type Execution Time panel in the screenshot provided below). Double clicking the bars will then open its flamegraph window.
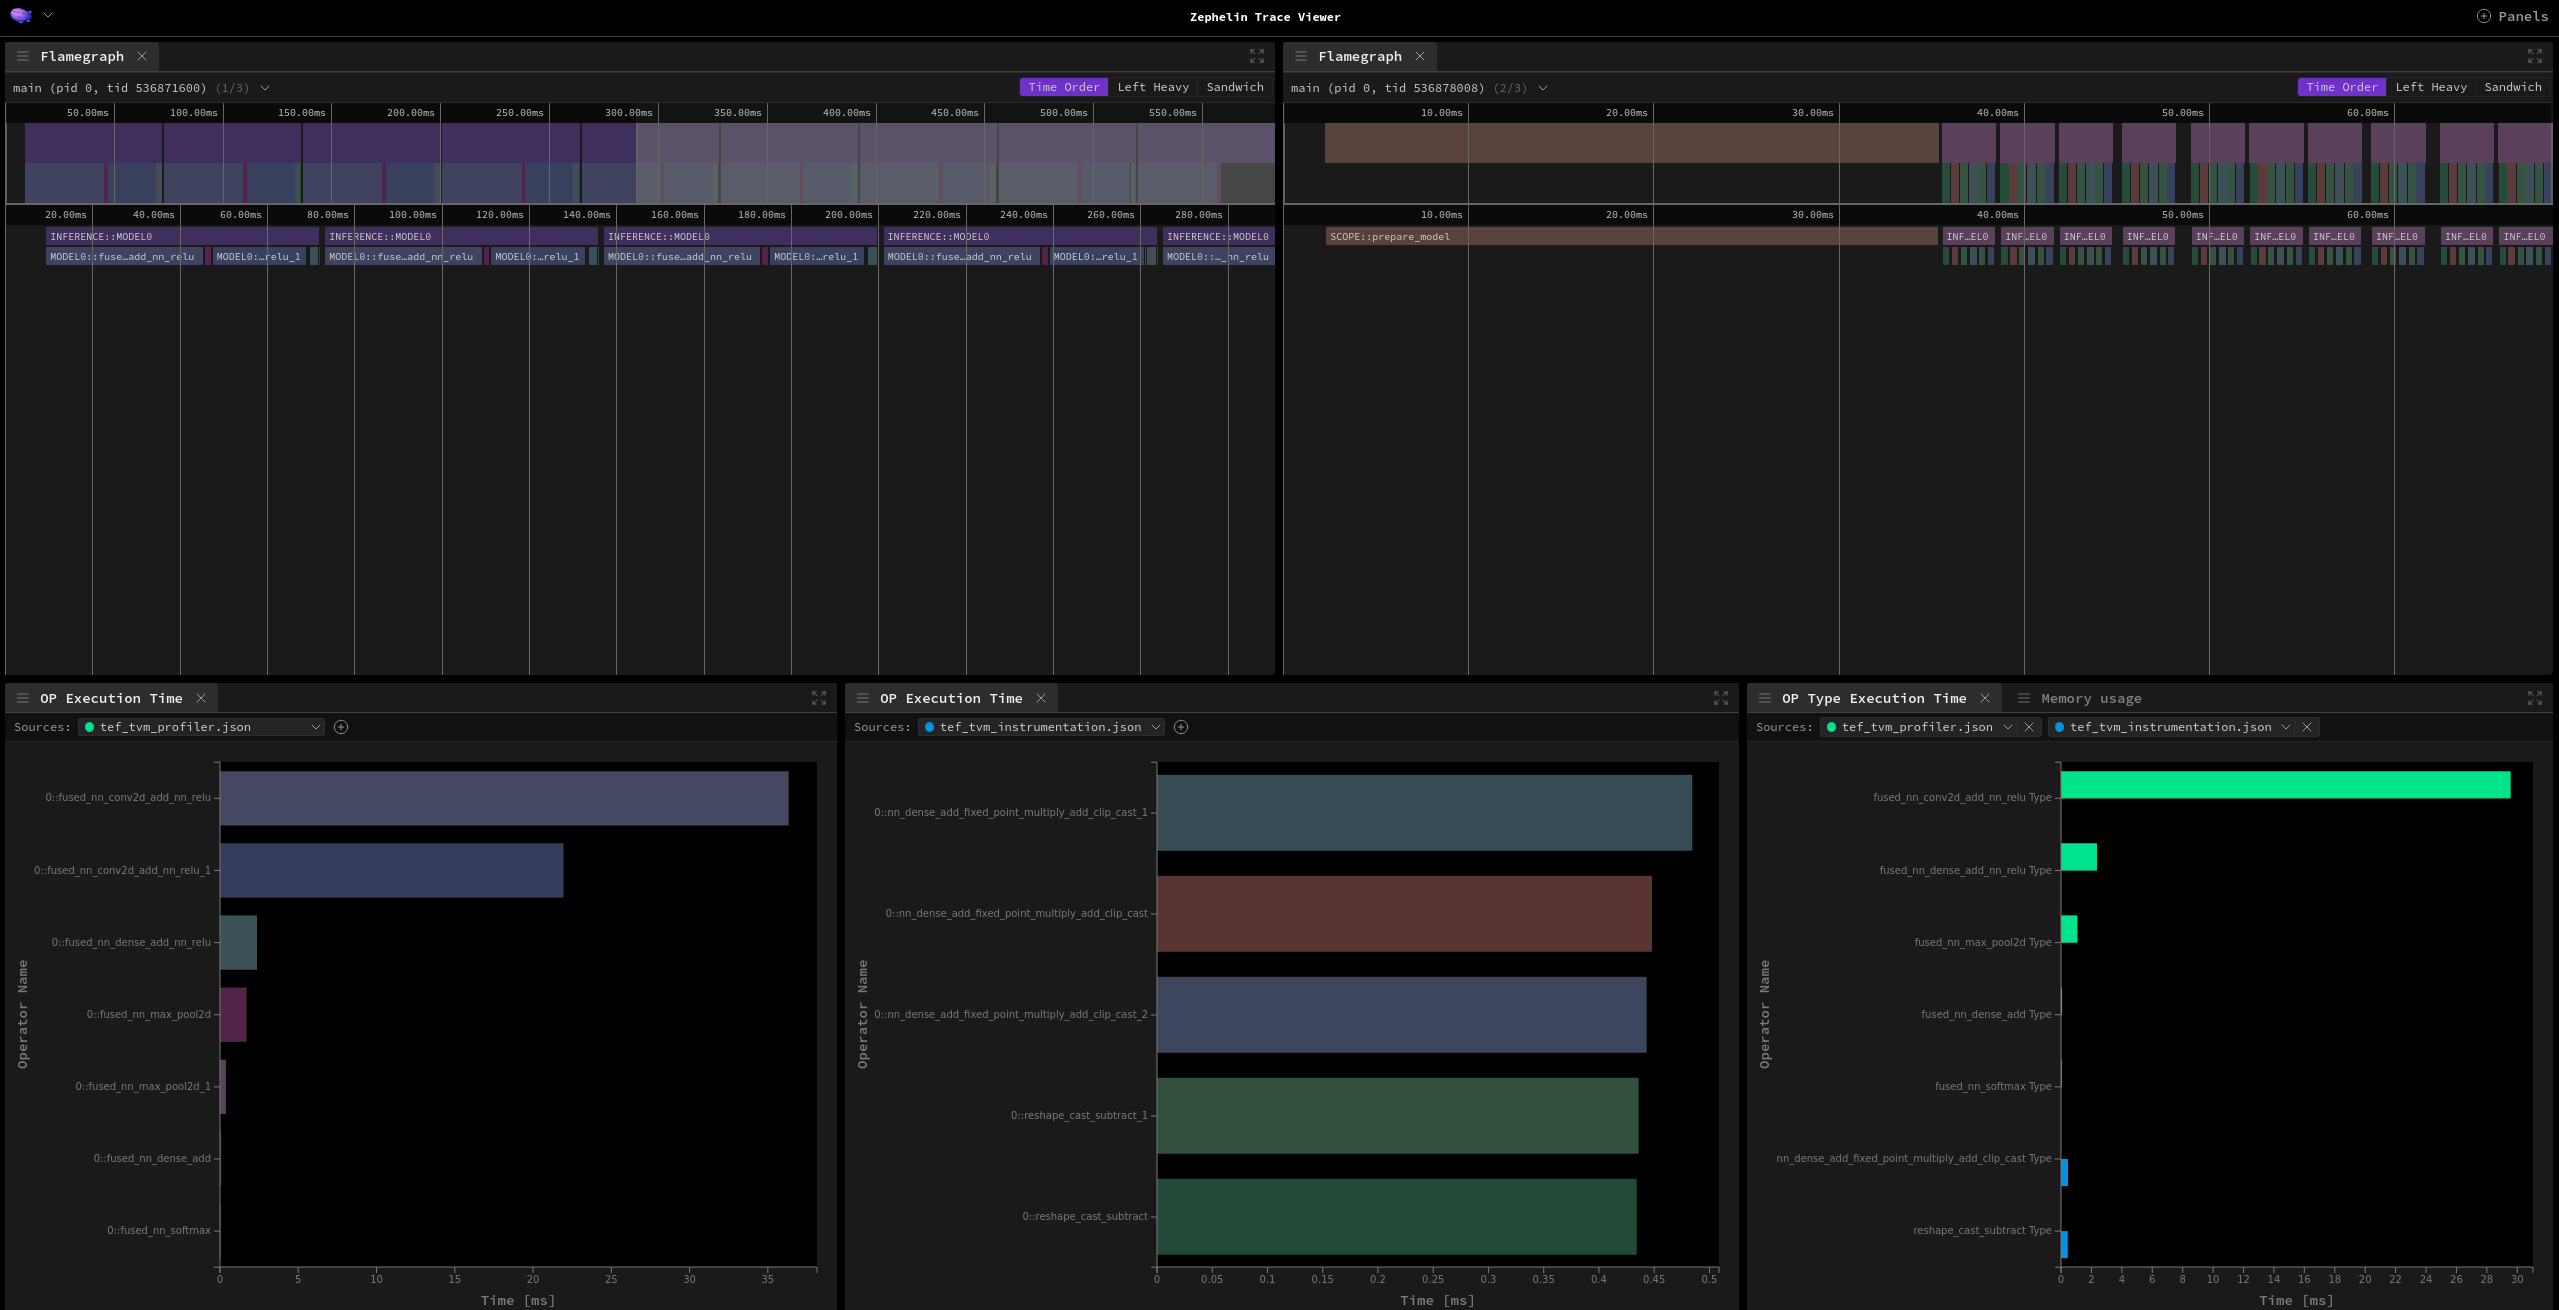
The example above can be found in Zephelin demos, after switching to view other threads than main in flamegraphs.
There were also several improvements in relation to multi-threaded applications on the side of Zephelin itself. We introduced additional metadata for threads in CTF events to allow associating specific events with specific threads. We also added the possibility to configure functions providing timestamps to the Tracing Subsystem - allowing users to use any custom clock or function to assign time to specific events. The feature is described in the documentation for custom clock source.
This specific feature allows to, for example, collect traces from multiple SoCs that share the same custom clock, and synchronize their events in order to analyze their interactions in the heterogeneous application. In such scenarios, each SoC will produce its own trace, which later needs to be converted separately against that node’s build directory, ELF and model files. Trace Viewer can then load both of the resulting TEF files together and merge them into a single session. Every node’s thread will appear in one profile list on the shared time axis, and all events are pooled so the CPU load, memory and sensor readouts cover the whole system rather then one board. An example can be found here. One SoC runs an audio preprocessor turning raw samples into spectographic features, forwards them over UART to a second SoC which runs the micro-speech model once enough data has been accumulated.
And, with the 1.0.0 release, Zephelin Trace Viewer can now be used directly from VSCode. You can either use it as a VSCode extension, or, if you use Analog Device’s CodeFusion Studio, Zephelin is now included in it by default as a dependency. This allows for viewing your collected traces without having to leave your work environment.
Track performance of your embedded Zephyr systems with Zephelin
Zephelin’s features allow you to trace and analyze the performance of your Zephyr applications, making it much easier to spot bottlenecks or problem areas and optimize performance, especially when working with embedded applications which require good performance with limited resources. With the newly introduced features such as live tracing and interconnected applications, complex setups can also be analyzed just as easily.
Antmicro has a wide portfolio of optimization solutions, including optimization and deployment of AI models with our open source Kenning framework and Zephelin, as well as years of experience with helping our customers build devices running Zephyr RTOS. If you’re interested in optimizing your Zephyr applications and want to find out how we can help with that, reach out to us at contact@antmicro.com.