Modern automotive electronics rely on a variety of interconnected systems that are constantly exchanging data. Such communication is primarily facilitated by the CAN protocol, which enables messaging between multiple independent components like Electronic Control Units (ECUs), and the SPI or I2C protocols, which allow for short-distance data exchange between microcontrollers and their peripheral devices (e.g. sensors or memory chips). Validating the information transmitted across these communication buses is a key part of any testing workflow as it ensures the safe and reliable operation of a vehicle.
Renode, with its ability to simulate a broad range of hardware platforms, including the popular, open source Toyota RAMN testbed that we have recently simulated and integrated with the CARLA autonomous driving simulator, is the perfect fit for testing complex, multi-node, embedded systems like automotive applications, long before the target hardware is available. Its recently introduced GUI offers a comprehensive and user-friendly development experience where you can check various aspects of your simulated devices from a single interactive viewport.
Recently, to streamline bus communication testing and analysis in Renode, we have implemented CAN and SPI traffic analyzers directly into its GUI. These new features allow you to view bus activity in a table format, which makes it easy to inspect individual messages, identify traffic trends, and flag any anomalies.
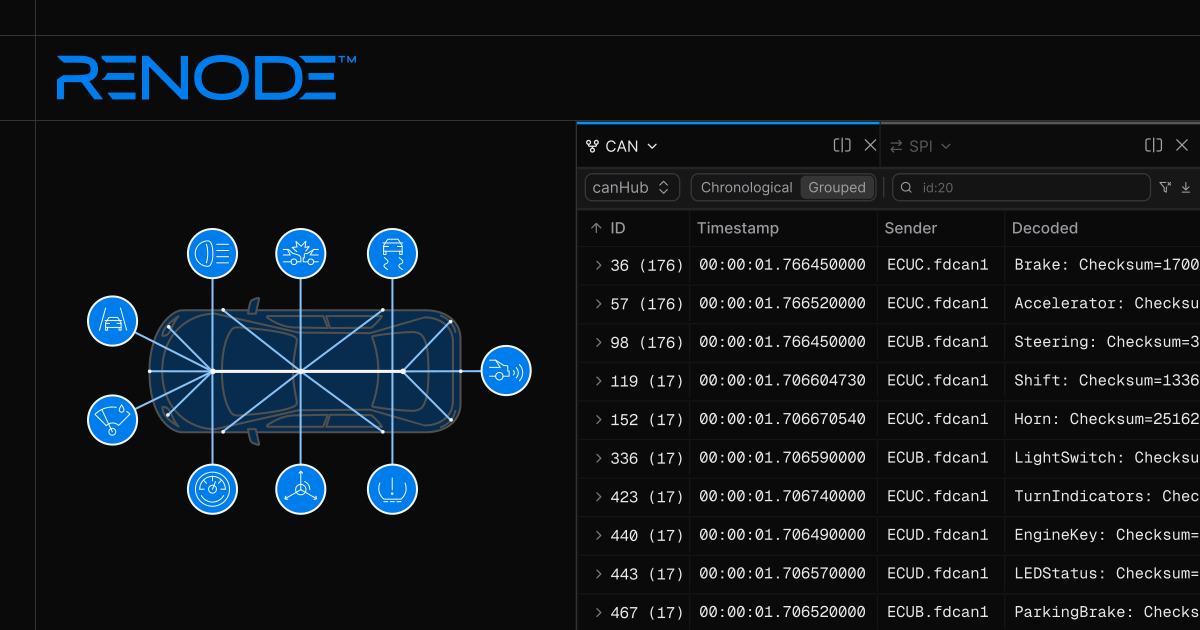
The new built-in CAN analyzer renders CAN bus data, as well as decodes and displays messages in a human-readable format based on a CAN database file, taking away the need to use external software for further data interpretation. With the implementation of SPI traffic visualization in Renode, it’s now possible to examine data bytes exchanged between chips as part of the simulation. What’s more - alongside these changes, the GUI now also features a display analyzer, allowing you to test graphical outputs of your simulated automotive platforms from a separate Displays tab.
In this article, we describe these latest improvements to Renode and demonstrate how they can help you test and debug your automotive systems on the example of a simulated Toyota RAMN setup.
CAN traffic inspection in automotive systems
In automotive applications, CAN is used to enable real-time communication between multiple ECUs that handle different vehicle systems - from acceleration and braking mechanisms to climate control and multi-media streaming. As many systems are sending data simultaneously over a shared bus, CAN is often characterized by dense, high-volume traffic. Filtering and interpreting messages from a single system for testing or troubleshooting can be quite time-consuming. Additionally, it’s represented as binary or hexadecimal data bytes that can’t be analyzed without prior decoding and interpretation with proper software tools.
The implementation of the CAN traffic analyzer in Renode described below factors in these characteristics of CAN traffic, aiming to enable faster and easier interpretation of CAN data in highly complex simulated systems.
Introducing a built-in CAN traffic analyzer in Renode
Up until now, to analyze communication on the CAN bus in Renode, you needed to set up a CAN network and connect it to a virtual CAN interface on a Linux host. CAN traffic would be routed through Renode’s SocketCAN bridge and exposed to other devices or applications, such as Wireshark.
Now, CAN traffic analysis in Renode comes as a native, built-in functionality available for host machines running not just Linux, but also Windows and macOS. Renode decodes and interprets CAN data using a CAN database file if one is available - and if not, it can present you with raw data for further analysis. The SocketCAN bridge functionality is still supported so you have the flexibility of using both workflows.
The new CAN analyzer in Renode provides key data points necessary for quick interpretation of CAN messages:
- ID: A unique identifier of a message, which also designates its priority: the lower the ID, the higher the priority. You can group messages associated with the same ID to isolate and analyze traffic coming from a specific system you want to test or debug.
- Timestamp: The exact time when a particular message was initiated. If you expect an ECU to send messages at a specific frequency, analyzing timestamps helps you understand if there are any anomalies that would indicate faulty operation.
- Sender: A CAN controller (e.g. ECU) that has initiated a CAN message.
- Data: The actual data transmitted from a sender on a CAN bus. If you have a CAN database file, you can load it to Renode (as we demonstrate in the following section) to view decoded, human-readable messages in the “Decoded” field.
Example: visualizing CAN traffic for the Toyota RAMN setup
In the following steps, we illustrate how you can view CAN traffic for the simulated Toyota RAMN setup:
For RAMN specifically, we provide a dedicated script which does the full setup for you:
(monitor) include @scripts/multi-node/ramn.rescIf you want to simulate CAN-based connections for other hardware targets, you need to configure the CANHub bus in Renode as specified in the official Renode documentation.
To launch a new tab with simulated CAN traffic in the Renode GUI, run the command below. In the example command, replace
canHubwith the name of your CAN bus:showAnalyzer canHubIf you have a CAN database file, you can also load it into Renode to translate CAN data into physical values, such as temperature in Celsius degrees or speed in km/h:
canHub LoadDBC @path/to/file.dbc
As demonstrated in the recording above, you can filter CAN traffic in Renode based on a range of attributes, such as message ID or specific data in the payload, for more focused inspection.
Analyzing SPI data exchange in Renode-simulated automotive setups
The SPI protocol is designed for facilitating high-speed synchronous communication between different components of an embedded system. In automotive applications, it enables exchanging bytes of data between a microcontroller and its peripheral devices, such as sensors or displays.
SPI traffic analysis is an entirely new functionality that we’ve added to Renode. It lets you check frequency and contents of communication in a microcontroller to identify any delays or other traffic anomalies that would impact the proper functioning of your embedded devices.
The new SPI traffic analyzer in Renode shows the following data for each SPI exchange:
- ID: A unique identifier of a message.
- Timestamp: The time when the message was initiated.
- PICO (peripheral in/controller out, MOSI): Shows a data byte sent from a controller to a peripheral.
- POCI (peripheral out/controller in, MISO): Shows a data byte sent from a peripheral to a controller.
- Peripheral: Indicates an active peripheral on a bus, which will receive bytes on the PICO line and send bytes on the POCI line.
Example: visualizing SPI data exchange for Toyota RAMN
The steps for launching SPI traffic analyzer in Renode are similar to how you open the CAN analyzer:
Execute a dedicated script for Toyota RAMN in the Renode
Monitor:include @scripts/multi-node/ramn.rescOnce loaded, the script starts the SPI analyzer automatically.
If you want to simulate SPI traffic for other hardware targets, run the following command instead:
showAnalyzer <SPI controller name>This will open a new tab in the Renode GUI:
Verifying graphical outputs of automotive devices in the Renode GUI
Another major improvement that we’ve made to Renode is the ability to view all frames rendered in simulated platforms from a separate Displays tab in the GUI.
Simulating display controllers has been a long-established feature in Renode - you could present graphical outputs of your devices either from the old Renode UI or via the FramebufferTester mechanism as part of Robot Framework tests.
With the new display analyzer, each display is now streamed through a Websocket API, just like the rest of the application.
To open the Displays tab, call:
showAnalyzer <display device name>Below is an example of a display rendered for Toyota RAMN:
As shown in the recording above, you can conveniently use the newly added display analyzer alongside the CAN and SPI analyzers. This allows you to verify the outputs of simulated displays on the fly, such as infotainment features or a vehicle’s Head-Up Display (HUD) system.
Simulate, test, and debug your multi-node automotive systems with Renode
The new built-in CAN and SPI traffic analyzers in Renode enable faster, more efficient inspection of bus traffic in complex multi-node automotive systems. The analyzers are easily accessible from the Renode GUI, where you can filter all transmitted data with just a few clicks. This helps you quickly identify any communication problems or traffic anomalies in simulated setups - a critical requirement for validating data flows in automotive applications, which rely on constant information exchange between a multitude of components.
Renode is ideally suited for testing both specific functionalities in your devices, such as network traffic or multi-sensor data flows, as well as entire automotive systems across a variety of use cases. Antmicro has been helping automotive customers achieve faster time-to-market and a better, fully-controlled development and testing environment with a broad range of commercial engineering services around the simulation framework, including adding new hardware targets, integrating Renode with external IDEs and tools, customizing it for particular CI/CD workflows, and more. Reach out to us at contact@antmicro.com to find our how to benefit from Antmicro’s Renode and the software-first approach in your next automotive project.