Tracing software execution on real hardware can be challenging, as to access the internal state of the components and the software itself you often need to attach specialized debugging hardware or instrument the source code. Since additional hardware can throw off the timing of events and desynchronize the whole system, and instrumented software may not always be able to use the highest level of compiler optimization, the gathered information may not be the same as for the normal binary.
As a whole-system simulator, Renode has complete awareness of the internal state of all simulated components, and can use this information to trace the execution of unmodified binaries without any behavioral changes to the simulation.
In this note we will cover some of the tracing features that Renode currently offers, how they can be used and what kind of output they provide.

All of the example outputs will be generated from the scripts/single-node/sifive_fe310.resc demo that is bundled with Renode, unless specified otherwise.
Once you run Renode, the platform can easily be loaded with:
include @scripts/single-node/sifive_fe310.rescNow, before you start the execution (using the start or s command), you can turn on various tracing options, as outlined below.
Logging executed function names
Renode can log names of functions that are currently executed by the guest application. This is very useful if you want to have simple information about the current progress in execution. Function names logging can be enabled using:
cpu LogFunctionNames trueAn example output would look like this:
cpu: Entering function _is_thread_time_slicing at 0x20403D68
cpu: Entering function _nano_sys_clock_tick_announce at 0x20403E3C
cpu: Entering function _nano_sys_clock_tick_announce at 0x20403E80
cpu: Entering function riscv_machine_timer_irq_handler at 0x20402F70
cpu: Entering function _arch_irq_disable (entry) at 0x204018F4
You can also add another true at the end of this command to remove duplicate function names from subsequent code blocks and achieve better overall performance. Example output from cpu LogFunctionNames true true:
cpu: Entering function _is_thread_time_slicing at 0x20403D68
cpu: Entering function _nano_sys_clock_tick_announce at 0x20403E3C
cpu: Entering function riscv_machine_timer_irq_handler at 0x20402F70
cpu: Entering function _arch_irq_disable (entry) at 0x204018F4
You can also filter the function names based on a prefix, if you, for example, want to see functions that start with “uart”. This can be enabled using:
cpu LogFunctionNames true "uart"You can use more than one prefix by separating them with a space. For example, instead of "uart", you can write "uart irq" to only log functions that start with either of those two prefixes.
Logging peripheral accesses
While executed functions information gives you an overall understanding of the execution, it is often beneficial to know additional context, for example to be able to understand why the application took a specific path.
To provide this additional context, Renode can log accesses to peripherals. This feature allows you to see how your program uses, or doesn’t use, specific parts of the SoC.
You can enable this feature by using:
sysbus LogPeripheralAccess <peripheral-name> trueIf you are not sure what peripherals are available, you can use the peripherals command to get a list of all connected peripheral devices.
Example output from sysbus LogPeripheralAccess uart0 true:
uart0: [cpu: 0x20402D1C] ReadUInt32 from 0x0 (TransmitData), returned 0x0.
uart0: [cpu: 0x20402D24] WriteUInt32 to 0x0 (TransmitData), value 0x2A.
uart0: [cpu: 0x20402D1C] ReadUInt32 from 0x0 (TransmitData), returned 0x0.
uart0: [cpu: 0x20402D24] WriteUInt32 to 0x0 (TransmitData), value 0x2A.
The logs contain:
- the name of the peripheral,
- current value of the program counter,
- type and width of the access,
- offset of the access from the start of the peripheral and the name of the register that this offset maps to,
- the value that was either loaded or returned from the register.
You can also log accesses to all peripherals connected to the system bus:
sysbus LogAllPeripheralsAccess trueBoth of these peripheral access logging commands can be disabled by providing false instead of true as the last parameter.
This information, along with logged function names, can give you a fairly complete overview of your hardware and software behavior.
Opcode counting
Renode has the ability to count how many times a specific opcode was executed. This can be very helpful if you want to know if some special instructions, for example vector instructions, are executed in your program, or if you want to analyze more detailed statistics of your workflow.
To enable opcode counting use the following command:
cpu EnableOpcodesCounting trueAfter that you have to install a pattern of the opcode that you want to count. The pattern can be thought of as a regular expression that matches the opcode’s bits. 1 matches set bits, 0 matches unset bits and all other characters match any value. As an example we will use the scripts/single-node/versatile.resc demo to detect ARM’s branch and branch-with-link instructions. To install the counter patterns we will use these two commands:
cpu InstallOpcodeCounterPattern "bl" "****1011************************"
cpu InstallOpcodeCounterPattern "b"  "****1010************************"
The first parameter is the name of the counter and the second is the pattern. After running the demo for a moment we can use:
cpu GetAllOpcodesCountersto get the values of the counters printed to the monitor window. Example output from the ARM demo:
----------------
|Opcode|Count  |
----------------
|bl    |376816 |
|b     |9587263|
----------------
We can also use
cpu GetOpcodeCounter "<counter-name>"to get the value of a specified counter.
Renode offers predefined functions for RISC-V to install the patterns for you. You can use one of the following commands to install RISC-V specific opcode patterns:
cpu EnableRiscvOpcodesCounting- to install patterns for general instructions Example counter values:... |wfi |6741 | |csrrw |13493 | ... |csrrwi |2 | |csrrsi |0 | ... |beq |33795 | |bne |7057 | |blt |566 | ...cpu EnableCustomOpcodesCounting- to install patterns for custom RISC-V instructionscpu EnableVectorOpcodesCounting- to install patterns for RISC-V vector instructions
All those patterns are created from RISC-V opcode definition files. You can create a similar file for RISC-V with instructions that are of specific interest to you, and load the patterns using:
cpu EnableRiscvOpcodesCounting @path-to-fileExecution tracing
Renode has the ability to show you what the CPU is doing at any given time without changing anything in the code or using any specialized hardware. Execution tracing can be enabled using:
cpu CreateExecutionTracing <name> @path-to-file <mode>or
EnableExecutionTracing @path-to-file <mode>when using release 1.13.2 or older.
name is the name under which the tracer can be accessed in the monitor.
mode can be one of the following values:
PC- this mode saves all values of the program counter. Example:
0x20400000
0x20400004
0x20400008
0x2040000c
0x20401bc4
0x20401bc8
...Opcode- this mode saves all executed opcodes. Example:
0x0297
0x1028293
0x30529073
0x3B90106F
0x5FC00297
0x88C28293
...PCAndOpcode- this mode saves program counter values and the corresponding opcode that was executed. Example:
0x20400000: 0x0297
0x20400004: 0x1028293
0x20400008: 0x30529073
0x2040000c: 0x3B90106F
0x20401bc4: 0x5FC00297
0x20401bc8: 0x88C28293
...Disassembly- in addition to the value of the program counter and the corresponding opcode this mode uses a built-in LLVM-based disassembler to convert opcodes to human-readable instruction names with all of the used arguments. The output also includes the name of the symbol that this entry belongs to. Example:
0x20400000:   00000297  auipc t0, 0           [vinit (entry)]
0x20400004:   01028293  addi t0, t0, 16       [vinit+0x4 (guessed)]
0x20400008:   30529073  csrw mtvec, t0        [vinit+0x8 (guessed)]
0x2040000c:   3b90106f  j 7096                [vinit+0xC (guessed)]
0x20401bc4:   5fc00297  auipc t0, 392192      [__start (entry)]
0x20401bc8:   88c28293  addi t0, t0, -1908    [__start+0x4 (guessed)]
...
Additionally, the output from the PC, Opcode and PCAndOpcode modes can be saved to a binary format that can optionally be compressed. This format is faster to encode and produces smaller output files. To save to a binary file use:
cpu CreateExecutionTracing <name> @path-to-file <mode> trueIf you also want to compress the output, you can append another true to this command.
Content of the binary file can be viewed by using a script bundled with Renode. It can be invoked by running this command in your shell:
python3 <renode>/tools/execution_tracer/execution_tracer_reader.py
 path-to-dump-file
This will print the text content of the file to the standard output.
Execution metrics
Renode can gather and show you a few different metrics in the form of graphs. This information can be used to see bugs that could be hard to spot on real hardware, allowing you to check if, for example, all of the peripherals are used when they should be, or the scheduler assigns work to all of the CPU cores. The metrics that are available out of the box are: Executed instructions, Exceptions, Memory access, Peripheral access. You can read more about this feature in Renode’s documentation.
To enable metrics gathering use:
machine EnableProfiler @path-to-dump-fileThis command will gather all of the metrics. They can then be processed by a script included with Renode. You will first need to install all of the required dependencies by running:
python3 -m pip install --user -r
 <renode>/tools/metrics_analyzer/metrics_visualizer/requirements.txt
After that you can run this command from your shell to get the resulting graphs:
python3
 <renode>/tools/metrics_analyzer/metrics_visualizer/metrics-visualizer.py
 path-to-dump-file
Running this script will open a few windows with graphs. These graphs will also be saved to the disk as .png files.
Example graphs from the scripts/single-node/hifive_unleashed.resc demo are shown below:

You can also use a Python library located in tools/metris_analyzer/metrics_parser to extract this data programmatically.
Guest application profiling
Renode offers the ability to display a trace of the guest application’s execution in the form of an interactive flamegraph. This can be very useful when you want to see the relation between function calls and the time in which the program was executing the contents of the function. This feature is, for now, available on RISC-V, Cortex-A and Cortex-M CPUs.
To enable guest profiling use:
cpu EnableProfiler <output-format> @path-to-output-file <flush-instantly>Currently Renode supports two output formats:
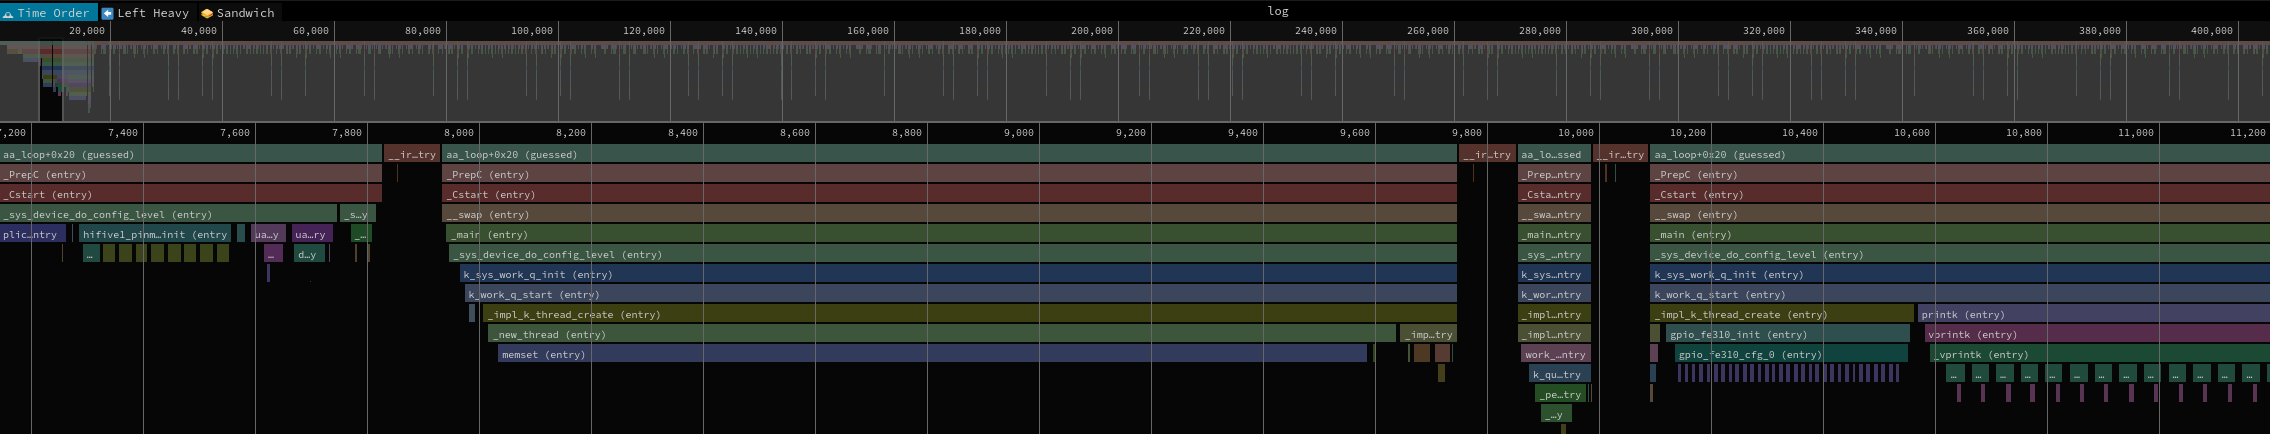
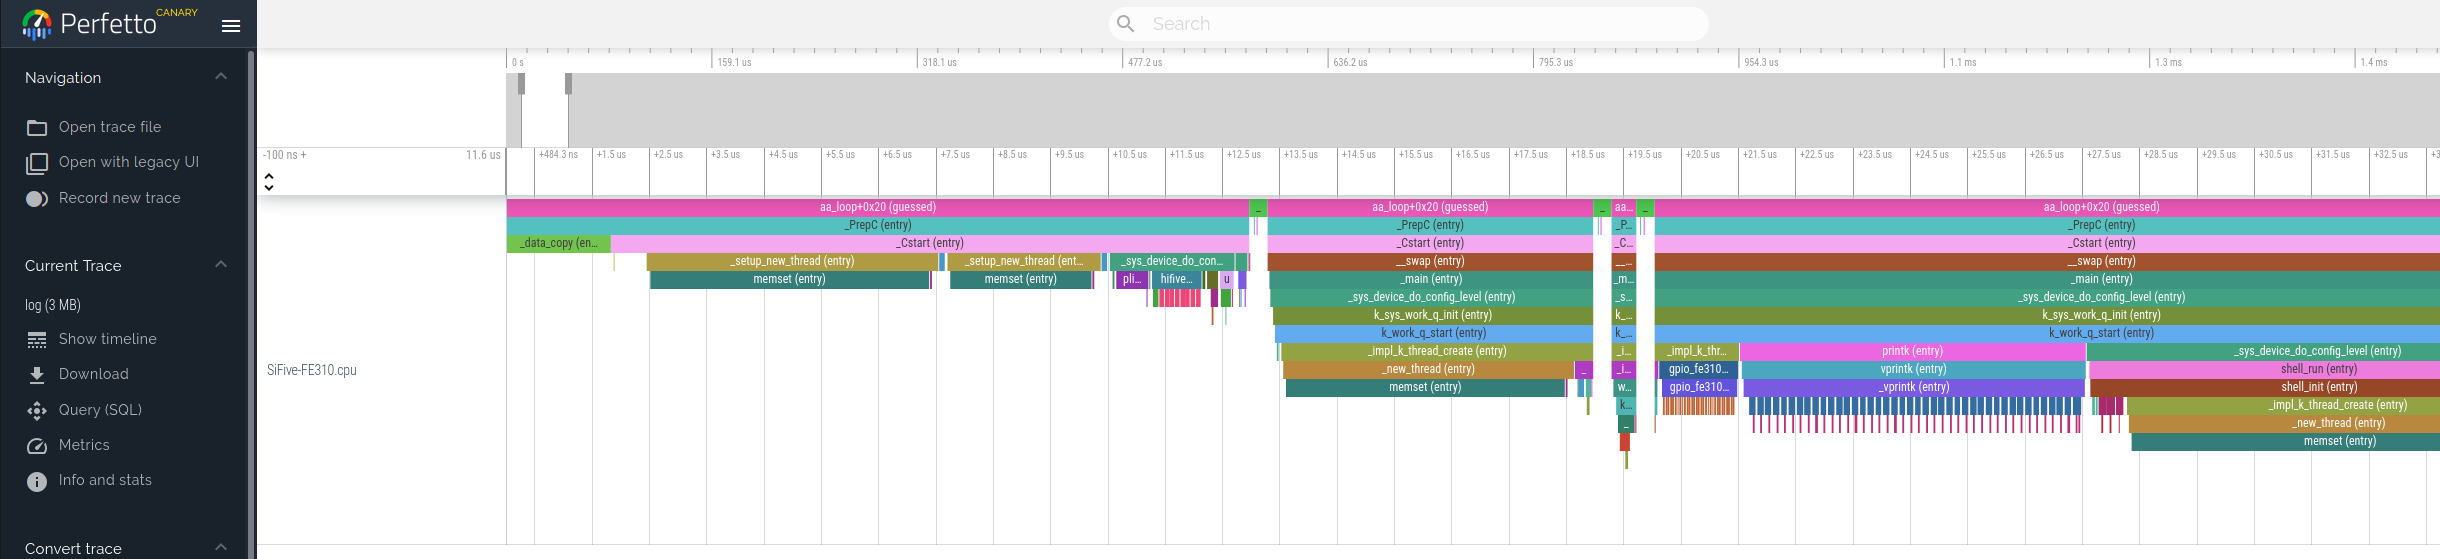
CollapsedStack- a text-based, collapsed stack format that can be viewed interactively using SpeedscopePerfetto- a binary format that can be viewed using Perfetto
Alternatively, you can also use cpu EnableProfilerCollapsedStack and cpu EnableProfilerPerfetto commands for the same effect.
By default Renode will buffer file operations for better performance, but this behavior can be modified to instantly write everything to a file by passing true as the third argument. If you don’t want to write to a file instantly but still want to have some control of when a flush occurs, you can use the following command to flush the buffer manually:
cpu FlushProfilerExample outputs for both formats:
CollapsedStackoutput format:
Perfettooutput format:
You can also inspect traces generated from Zephyr samples in Renodepedia - see the examples for RISC-V and Cortex-M.
Understand your software better with Renode
As you can see, Renode already offers a lot of features that provide insight into what exactly is happening on the simulated hardware, and we still have a lot of plans for improvements and new features for this part of Renode. Some of these plans include:
- gcov integration that will enable users to create code coverage reports for unmodified executables,
- adding more information to the guest profiler’s Perfetto output format. This may include displaying execution of each process on a separate track, adding event annotations to the timeline and more,
- creating a unified, binary format for all of the described features to collect them in one place, improve simulation performance and allow for post-mortem analysis,
- unifying the available mechanisms to form a single tracing framework.
If you need any help with profiling your systems using Renode or if you would like to see new tracing features - or improvements to existing ones - you can reach out to us at contact@antmicro.com.


