Improved and automated image data analysis with Raviewer's new features
Published:
Topics: Open machine vision, Open source tools
Antmicro’s open source Raviewer tool allows developers working with camera systems, especially in embedded applications, to inspect data collected by sensors in a raw, preprocessed format – to verify correctness of the data, debug problems, understand the incoming data and more, as described in more detail in the introductory blog note. It is especially useful when working with camera drivers or when you need to find out how additional data (such as Phase Detection Auto Focus, or PDAF) is embedded in the frame data.
In this note we present and explain the principles of the most recent improvements introduced in Raviewer, inspired by our internal needs as well as real-life issues encountered in our customer projects which involve developing new camera systems or creating and debugging drivers. These changes significantly simplify the debugging process by providing performance improvements, raw image previews, automatic image format detection and resolution prediction, as well as a better user experience.
Apart from using Raviewer as a UI tool for image analysis, we can also treat it as a Python module that provides fast image conversions, support for less popular image formats, and image format prediction. Raviewer has already proven useful in numerous machine vision projects involving interfaces such as MIPI-CSI2, GMSL (for which we have recently developed a ser-des setup), SDI, CameraLink or CoaXPress and we often use it in our work when building customized edge AI devices based on our open hardware platforms such as Jetson Orin Baseboard or the Kria K26 basaboard.

Raw image previews
When working with images from a sensor, we sometimes need to check what data arrived from the camera to better understand the underlying information, discover potential errors in the processing pipelines, or to find proper shifts and alignments of pixels in the data. To facilitate that, Raviewer allows you to render a raw view of a frame, before the demosaicing stage. We can also simplify the raw data analysis by specifying colors representing image format components (e.g. Y, U and V in YUV images) – each pixel representing raw data value will be colored based on its association to image format component (based on its location).
Displaying the raw view of a frame is especially useful when debugging. Consider the following scenario: the initial portion of planar YUV image data got corrupted and the Y channel no longer provides meaningful information, so displaying the image without the raw view results in a discolored image:
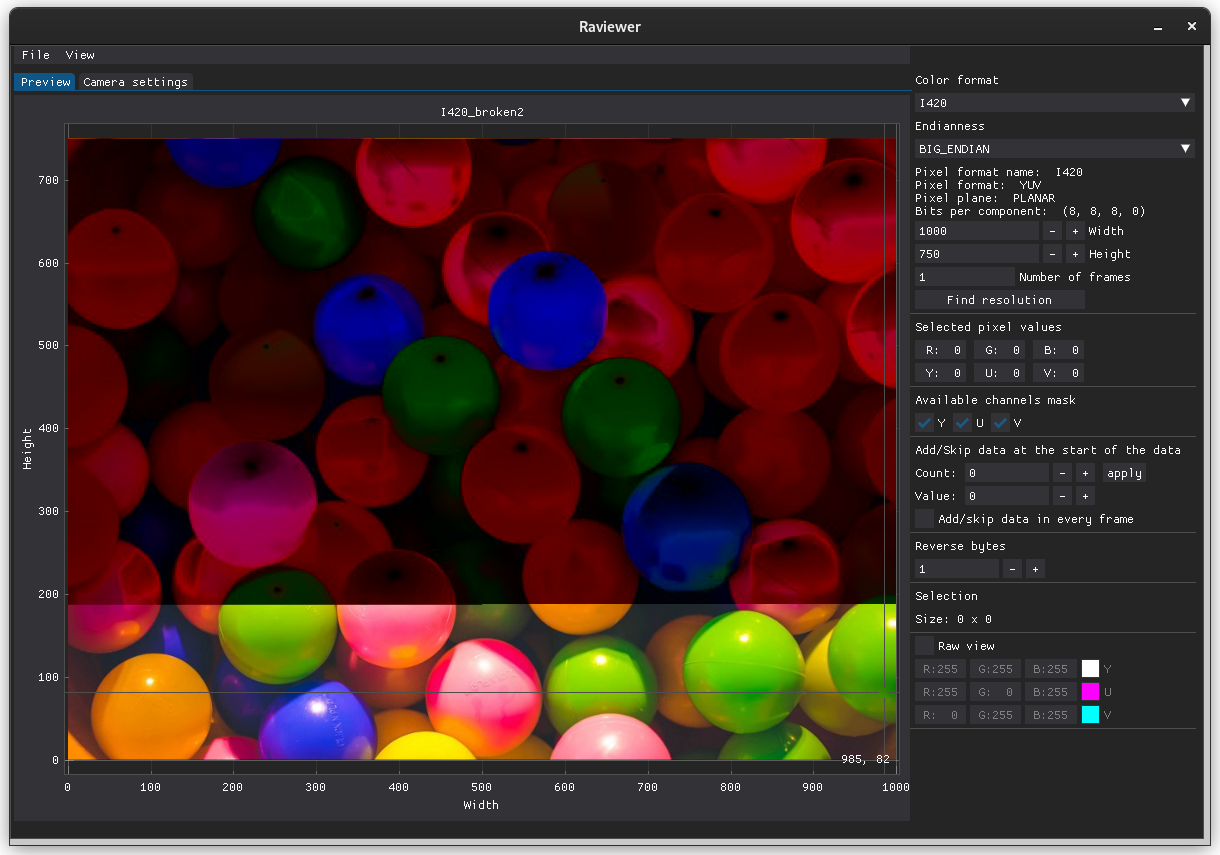
With a raw view, it is considerably easier to narrow down possible causes of the error by inspecting each channel separately.
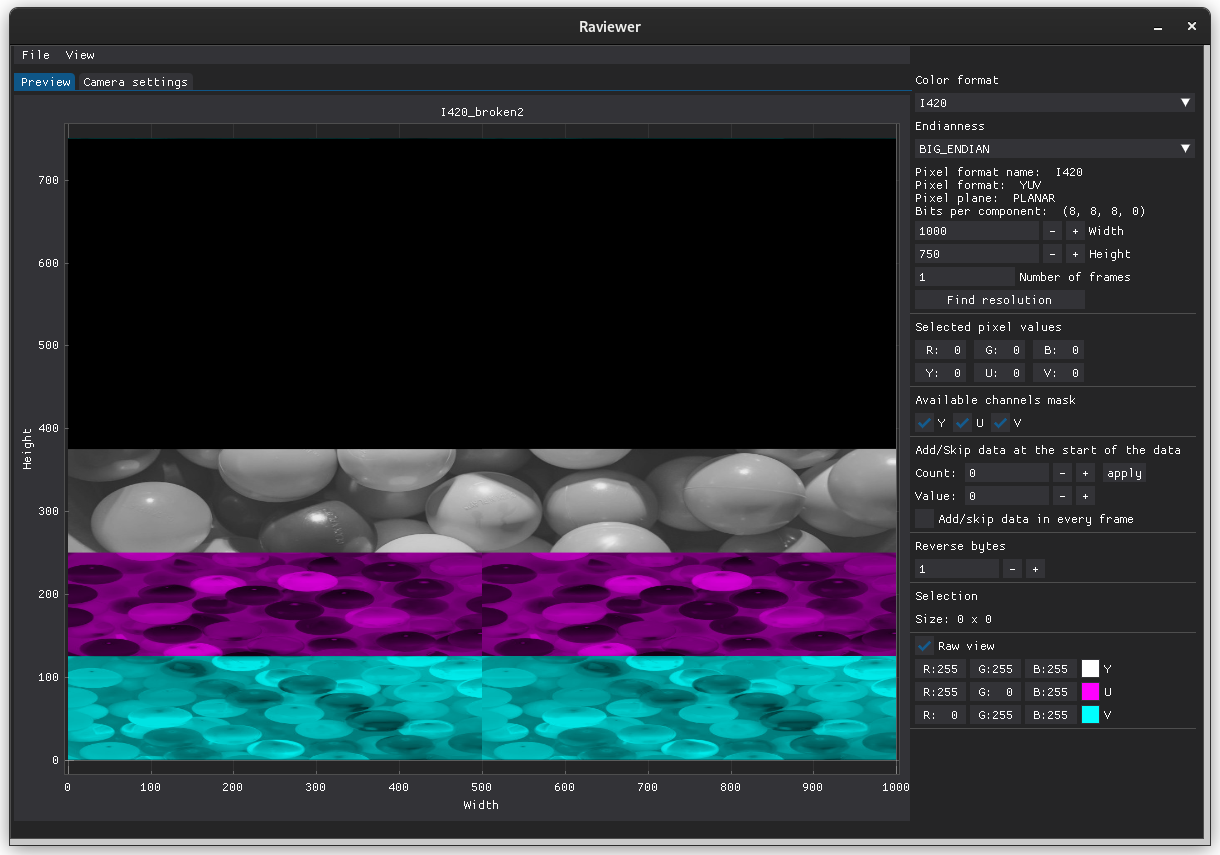
Image format recognition
To further simplify working with raw images, we introduced an initial image format recognition algorithm that seeks distinctive data patterns appearing in various image formats. The algorithm consists of a set of rules that analyze an array of bytes received as input. These rules altogether form a decision tree that gradually narrows down the set of matching image formats. Part of this decision tree is shown below.

The first group of rules is based on analyzing individual values present in the input array, for example:
- Group values in the array into 2 bytes and check if values fall in ranges that could be represented by 10 or 12 bits – this may indicate dealing with 12-bit and 10-bit pixel values.
- Check if there are any periodical sequences of bits set to 1 – this may indicate that the image format is one of the formats which include the A channel (RGBA444, RGBA555, RGBA32 or their alternatives).
- Check if values in the data fall within the range from 16 to 240 – this limited range is responsible for mimicking the colors from analog TVs, suggesting a YUV-type format.
After pixel-wise checks, we have another group of rules that take all pixel values belonging to an assumed format component (e.g. all values forming the Y channel in the YUV format) and check if it is possible that these values can indeed form the given channel. These rules operate on the assumption that the data for a single correct channel should be less “noisy” than the data for the whole image or an incorrectly predicted channel.
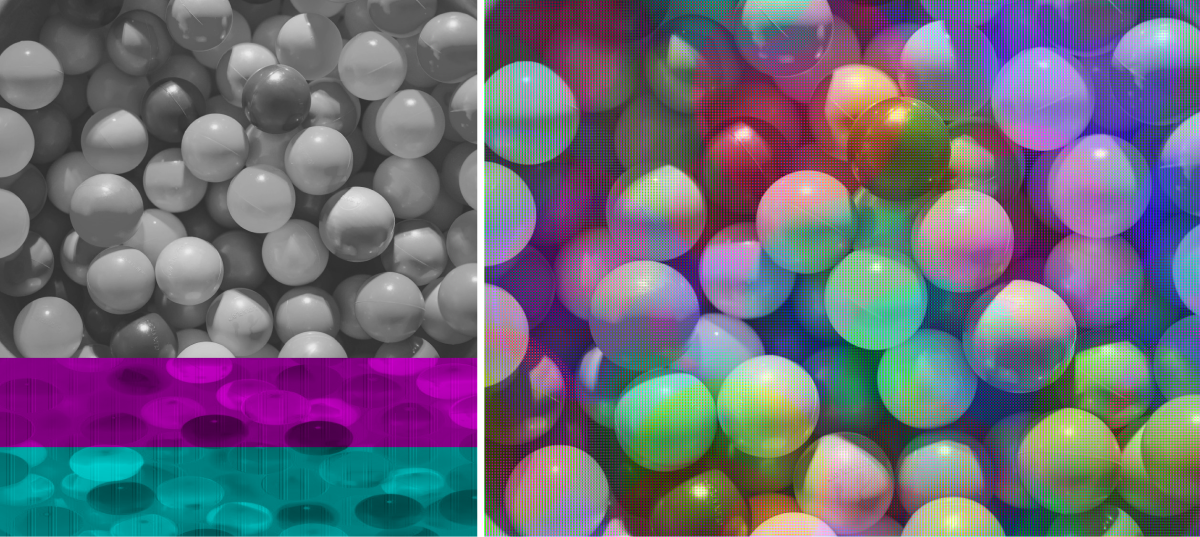
During the process of format recognition, analyzing rolling standard deviation has multiple applications. It allows, for instance, to distinguish YUV formats, which feature a Y channel called ‘luminance’ corresponding to grayscale, along with U and V channels called ‘chrominance,’ containing color information.
Luminance usually has observably smaller variance than chrominance channels and this fact is used in the decision process, so an intuitive illustration for such a phenomenon is easy to imagine. Two balls, red and blue, lying next to each other will have different chrominance values due to their independent colors, but luminance values are much closer because the light source in the photo is common for both balls.
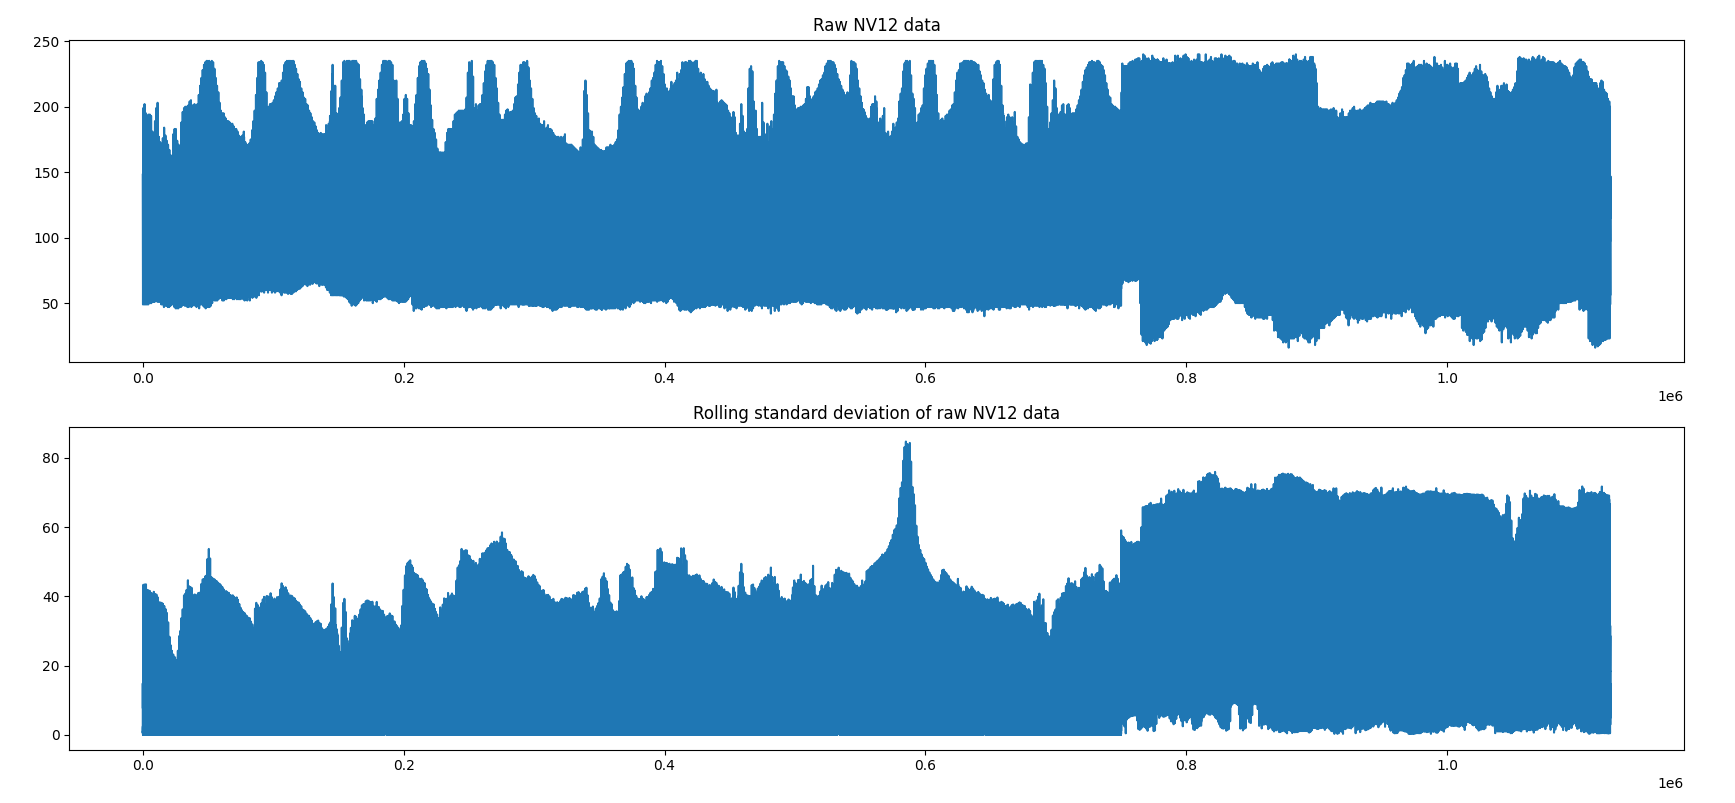
There are YUV format types called ‘planar’ and ‘semiplanar’ that separate the Y channel from the rest of the data. NV12 can serve as an example of a semiplanar format. Treating input data in this format as a series allows for creating plots with visible transitions from luminance to chrominance at around two thirds of the series’ length. This change in values of the data is measured by calculating the rolling standard deviation shown below in the second plot.
The effect of the correct and incorrect extraction of chrominance (U and V) channels in rolling standard deviation is visible in the plots below. The median of the rolling standard deviation is the final parameter used to compare results.
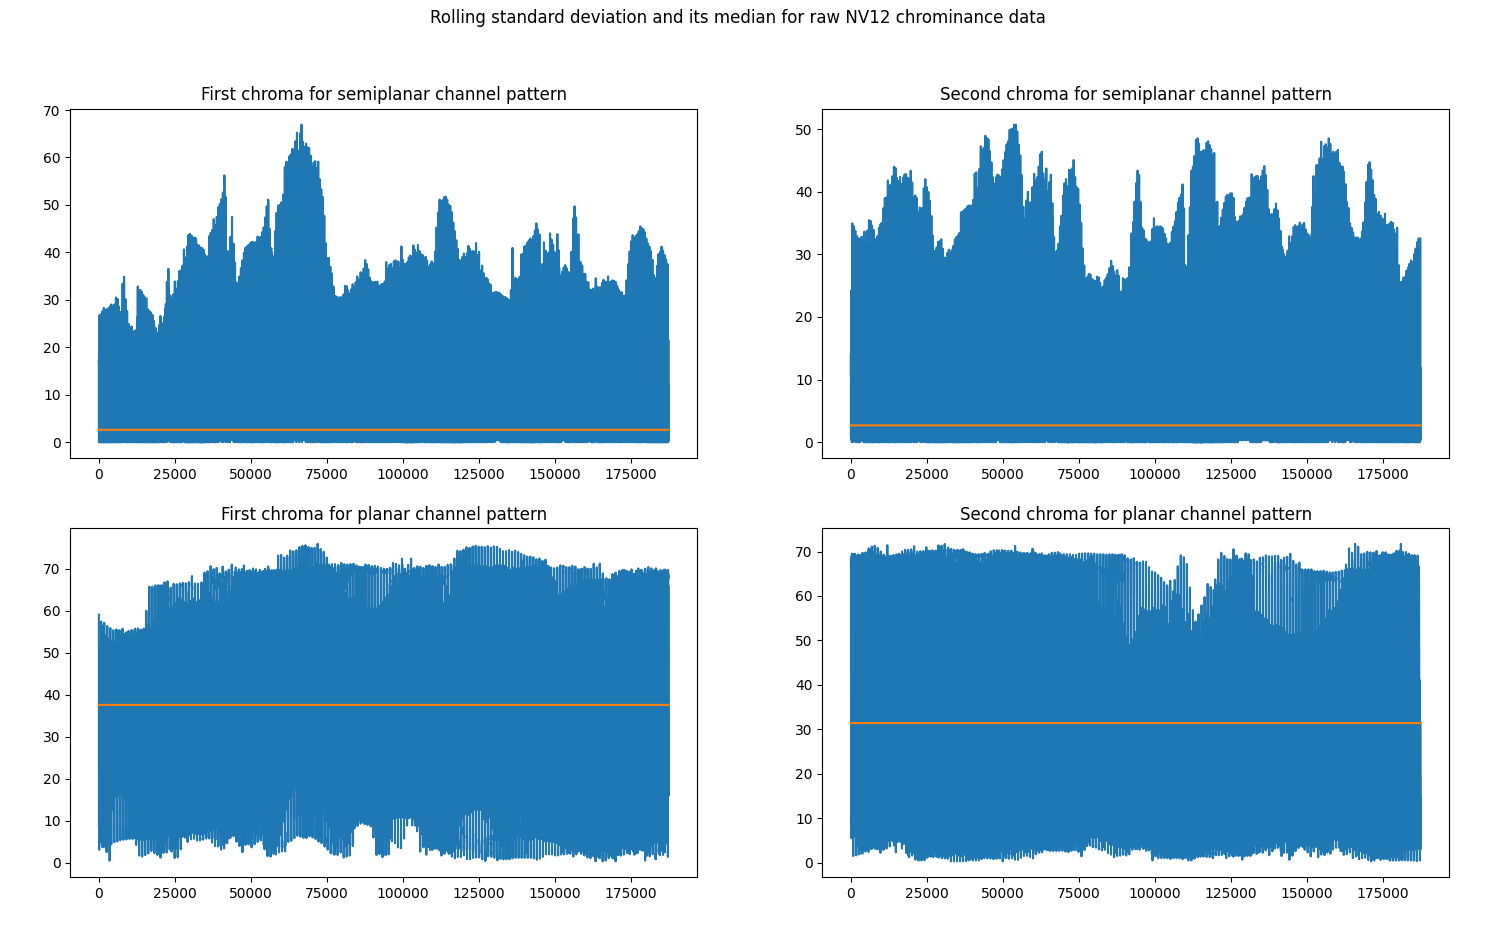
Treating an NV12 image as planar format with the U and V channels separated yields visibly incorrect results – the rolling deviation is consistently high.
The rolling version is sensitive to differences between interleaved and separated channels. In this scenario, luminance is aligned properly for the most part, so the raw view is partially correct. Below, you can see the NV12 image as raw view of planar (left) and regular view of planar (right).
A simplified calculation of rolling variance may be visualized as follows: take an image containing one plain color for which U and V channels have two different – but constant – values. Let the window for rolling statistics be of size 2 (Raviewer uses windows of size 10 and 20), which simply detects changes in 2 consecutive pixels. Choosing an incorrect channel pattern leads to discovering a change in UV values at all possible places. With the correct pattern, a significant change should be only detected once.

The remaining rules for groups of pixels revolve around checking whether rolling variance for proposed formats and correlation of values in proposed channels are high (e.g. in RGGB).
Endianness prediction
Another characteristic of the image format that can be automatically predicted with Raviewer’s new features is endianness. Incorrect endianness leads to visible artifacts in an image:
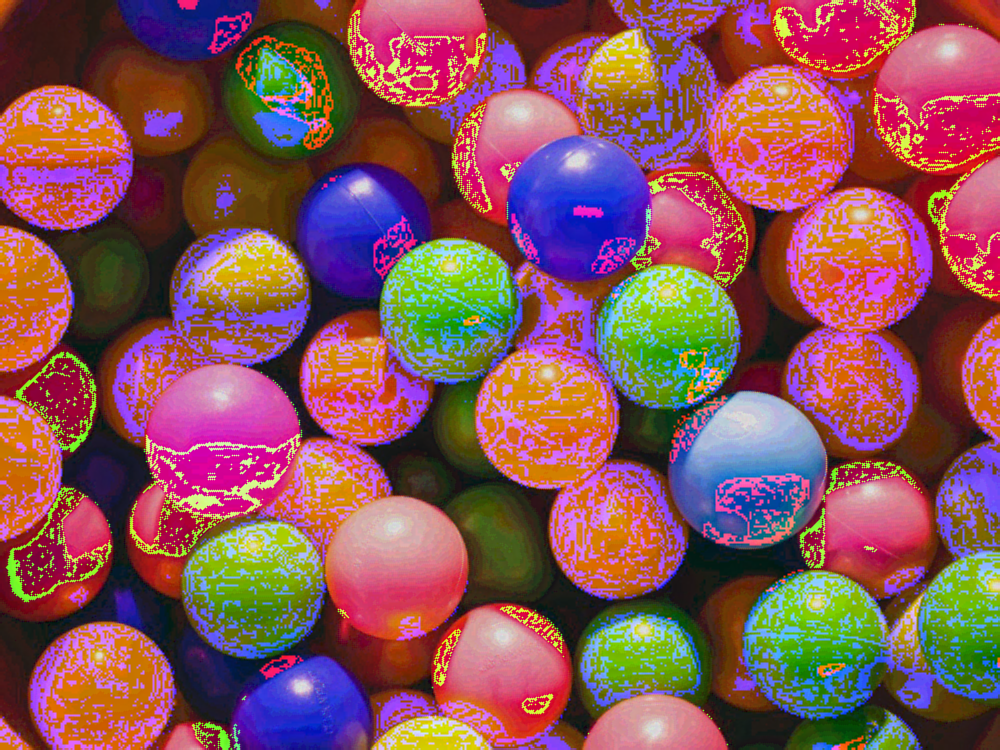
To determine the endianness of the formats that use two byte data for each color value, we look for characteristic patterns in the data. For example, a series of bits set to ones throughout all color values may indicate the position of the alpha channel and determine endianness. The alpha channel for unedited images from a camera is set to the maximal value because such images are fully opaque and do not vary in transparency. Similarly, unused bits in the 10-bit and 12-bit representations are used to find the correct order of bytes. For other formats, endianness prediction is a result of comparing rolling standard deviation between both orders of bytes. The underlying assumption about “noisiness” of the incorrect prediction applies here again. Lower bits of the pixel values change upon smaller changes in the image itself when compared to the upper bits and small changes in the image which naturally occur more often. Swapping bytes swaps the importance of the bits, which results in small but frequent changes in the image, now having a massive impact on data variance.
It is worth noting that many of the formats used in Raviewer utilize just one byte per color per pixel, so this part of the prediction process does not apply to them, as swapping the order of just one byte does not change anything in the data.
Image resolution prediction
When it comes to predicting resolution, we base the prediction on edges detected in the images by reshaping the raw data. Knowing the image format, we can propose potential resolutions based on the fact that each format has a different number of bytes of data per one pixel in the resulting image. What is interesting, this ratio does not need to be an integer, like in the case of the YUV420 format, where, for every 8 pixels, there are 8 luminance values, 2 red chrominance and 2 blue chrominance values, resulting in 1.5 byte per pixel on average. Information shared across multiple pixels (chrominance, in this example), allows non-integer ratios to appear. The only condition that has to be satisfied at this stage, is that the total number of bytes in the raw data multiplied by the format’s factor needs to be an integer. This means that the amount of input data must be feasible from the considered format’s standpoint; resolution candidates are simply pairs of integers, whose product is equal to the number of pixels in the final image. From this point on, we create images from raw data with a given data format for every resolution candidate.
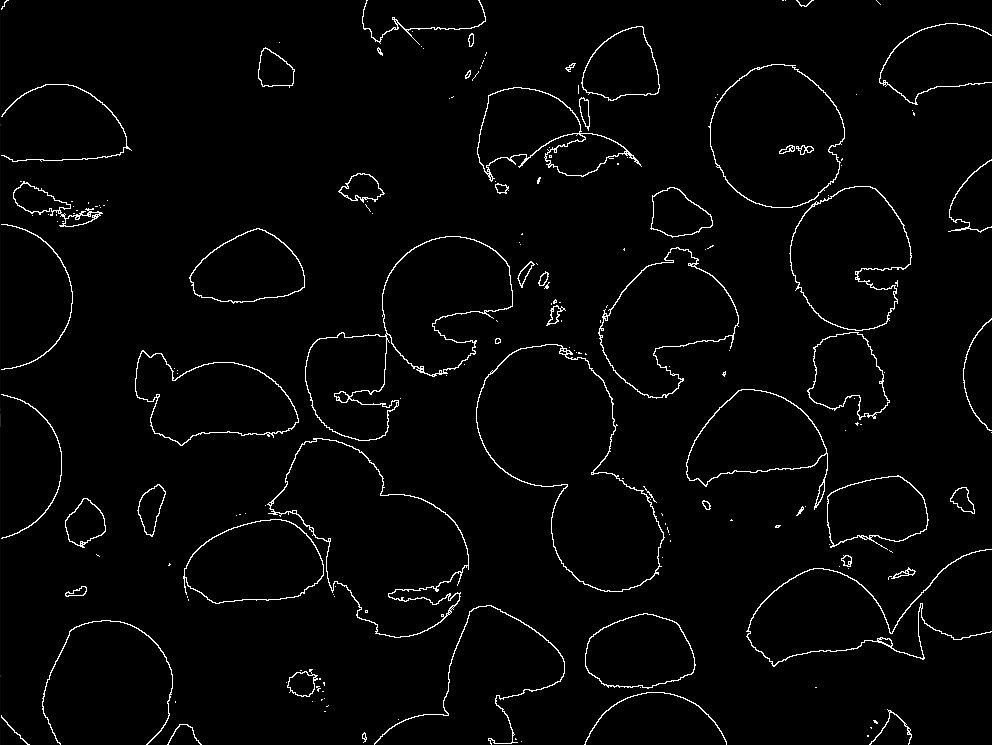
Next, we run edge detection on each resolution candidate. For noisy, distorted data we usually detect a lot of edges, which may suggest an incorrect resolution. For the correct/possible resolutions, we should get a relatively small number of edges.
For example, the result of edge detection for a correctly picked resolution can look like this:
While the results for an incorrectly picked resolution look like this for the same picture:
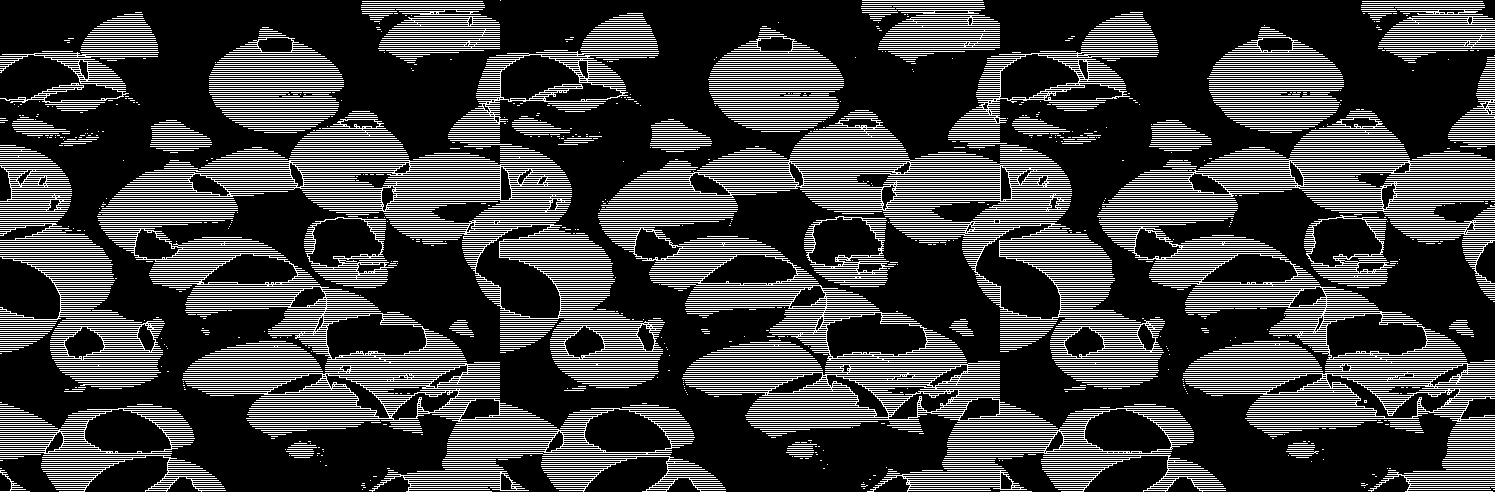
The parts of the picture that look colored with gray are actually very densely packed white and black stripes that are caused by artifacts appearing in images with an incorrectly picked resolution.
For manual usage, Raviewer’s resolution prediction algorithm returns more than one match. Resolutions that have more edges, but still were in the top of the ranking, are accessible via a dedicated ‘Find resolution’ button.
Enhanced image data analysis with Raviewer
The current, analytical approaches based on classic image processing are initial steps towards creating more robust and advanced algorithms for image format detection. With such mechanisms in place, we can implement applications that can easily adapt to different cameras without the necessity of explicitly specifying image formats, as well as improve the workflow when working with new cameras and their drivers, by finding issues in camera configuration or data delivery format.
This is just one of the many projects developed by Antmicro that simplify and improve performance of computer vision applications on embedded devices – we also develop libraries such as pyrav4l2, grabthecam and farshow which help in developing advanced applications involving complex computer vision flows.
If you’re interested in integrating the tools described above in your workflow or would like to develop your next computer vision project with Antmicro, don’t hesitate to contact us at contact@antmicro.com.