Ghidra is an open source software analysis framework that provides numerous features that help developers understand how compiled software works, without access to the source code. Its main purpose is analyzing malicious software, as it allows inspecting the functionality of malware samples without running them.
Since Ghidra can decompile binaries into C that’s human-readable and therefore easier to analyze than an assembly dump, it also found use in debugging, function identifying and mapping, and determining the purpose of binaries. On top of the various analysis features, Ghidra offers extensive support for developing custom plugins, making it easily extendable for new use cases.
In this article we introduce girdl, Antmicro’s plugin for Ghidra that automatically detects accesses to peripherals and their registers in the decompiled code, based on analysis of register description files such as RDLs and SVDs. In the following paragraphs we will describe how to use girdl and show how we verified its functionality, using a precompiled driver for the open source I3C core Antmicro developed for the CHIPS Alliance as an example.

Analyzing registers with girdl
The girdl plugin allows you to load register description files into Ghidra and then analyze the binding of individual registers and their layouts. It supports various sources of data, including:
- RDLs, either generated by Renode or from other sources
- SVDs, which are typically provided by SoC manufacturers
- JSONs generated by the Renode Models Analyzer and peripheral maps generated by Renode from REPLs
Additionally, girdl allows combining multiple types of files and loading them at once using archives or directories - in that case, the plugin will search all containers recursively.
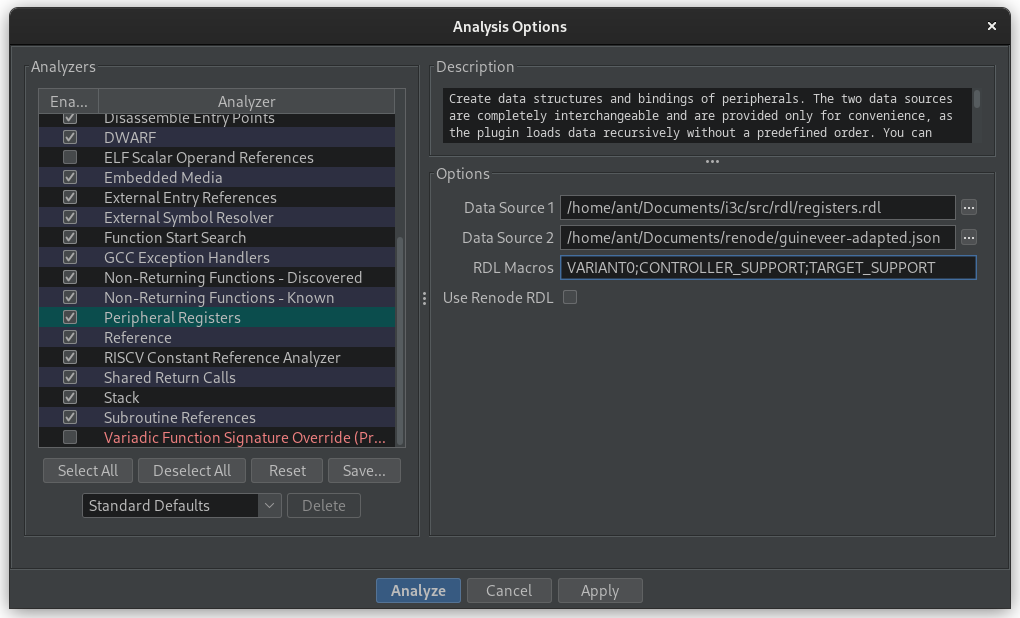
Renode supports SystemRDL, a standard from the Accelera initiative used to describe the register layout of hardware, as described in more detail in a dedicated article. You can extract SystemRDL files from Renode models using Renode Models Analyzer. As these RDLs contain only the layout of registers within a peripheral, and not their exact placement in memory, Renode offers another functionality that allows you to create JSON files out of the platform descriptions. So, effectively, you would need to load your REPL, run the peripherals export command and receive a file that can then be consumed by girdl with the Renode-generated RDL. To simplify girdl’s usage with Renode-based sources, we implemented an additional Use Renode RDL option that can be used to import data from the most recent Renode build. For more details about using specific data formats, refer to the documentation.
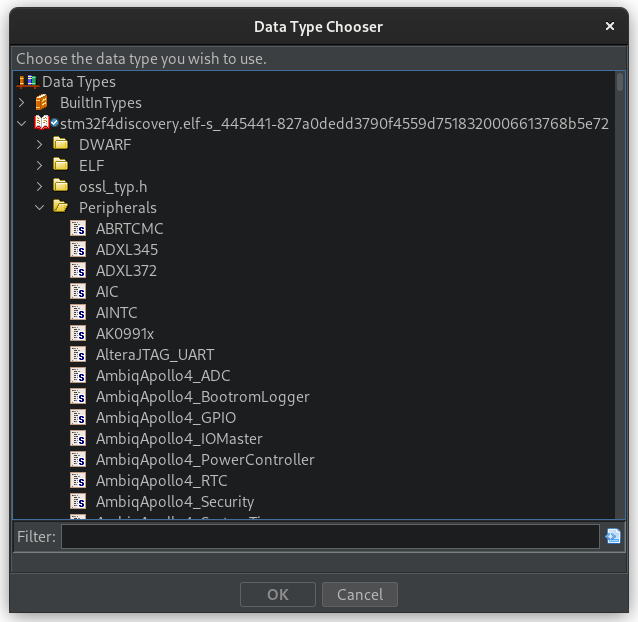
Once the input files are loaded, girdl extracts data types from all supported data sources and each peripheral is assigned a struct that matches its register layout. Peripheral types can be found in the Retype Variable menu under ExecutableFileName > Peripherals.
Usage example with Renode
Let’s showcase girdl’s usage with a simple demo application for the STM32F4 Discovery. First, follow the instructions in the documentation to setup Ghidra with girdl.
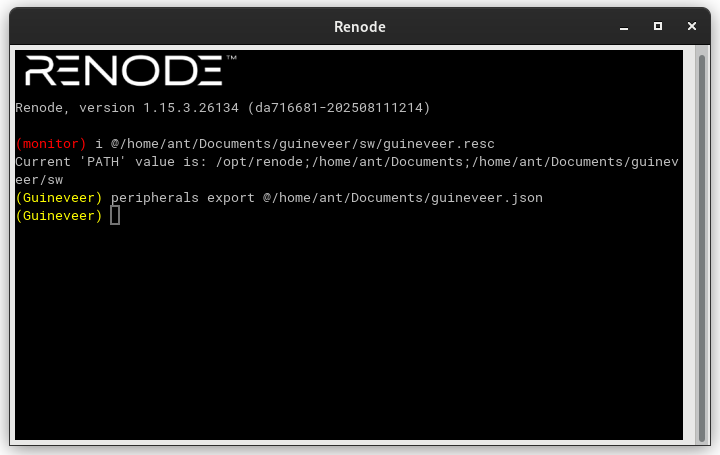
You will also need the Peripheral Map exported from Renode for the platform as shown below.
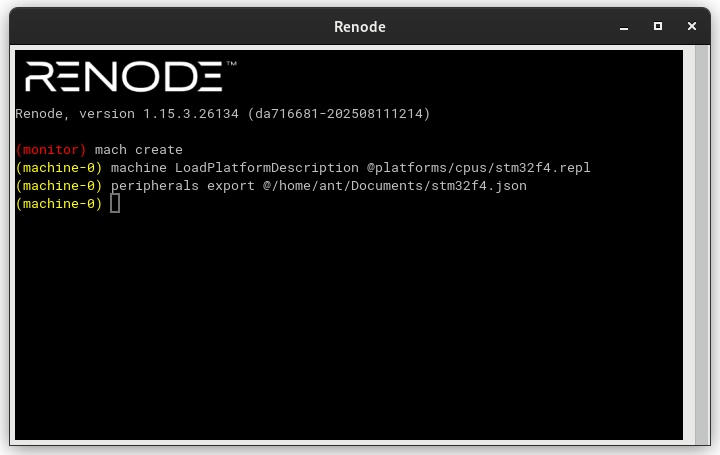
For the STM32F4 Discovery, you can just use standard Renode RDL (the “Use Renode RDL” checkbox) with a Peripheral Map exported while emulating the application in Renode.
After clicking “Analyze”, you will see that all the peripherals used by this program get added to the Program Tree panel (on the left). You can click on them to reveal their structure, registers and positions in memory. Ghidra will also show all references next to each register, indicating their type (Read/Write).
If you go to the uart4_init() function, you will also see that the pointer to uart4 gets passed to USART_Init() on line 33, which is especially helpful when there are no debug symbols present. Ghidra will be able to deduce the type of function parameters, based on the values passed to USART_Init, and instead of declaring it as USART_Init(int*, int*), you will see USART_Init(STM32_UART*, int*). You can also see the names of registers within the selected region, based on the pointer to the peripheral type. If for some reason Ghidra fails to detect the type of a function argument as a peripheral, you can use the standard Ghidra workflow to retype that variable to a peripheral - just right click on it and select Retype Variable, then select the executable and peripherals.
The entire flow is shown in the video below:
Here is a comparison of STM32F4 without the plugin, and with the plugin in use:
STM32F4 - no plugin 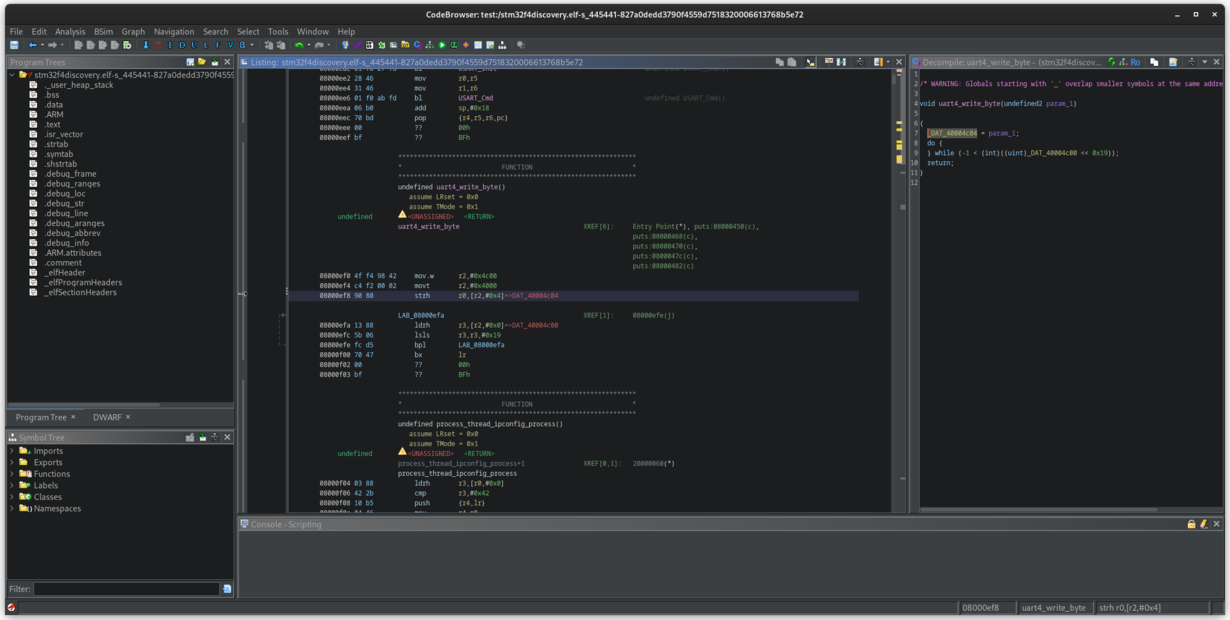
STM32F4 with plugin 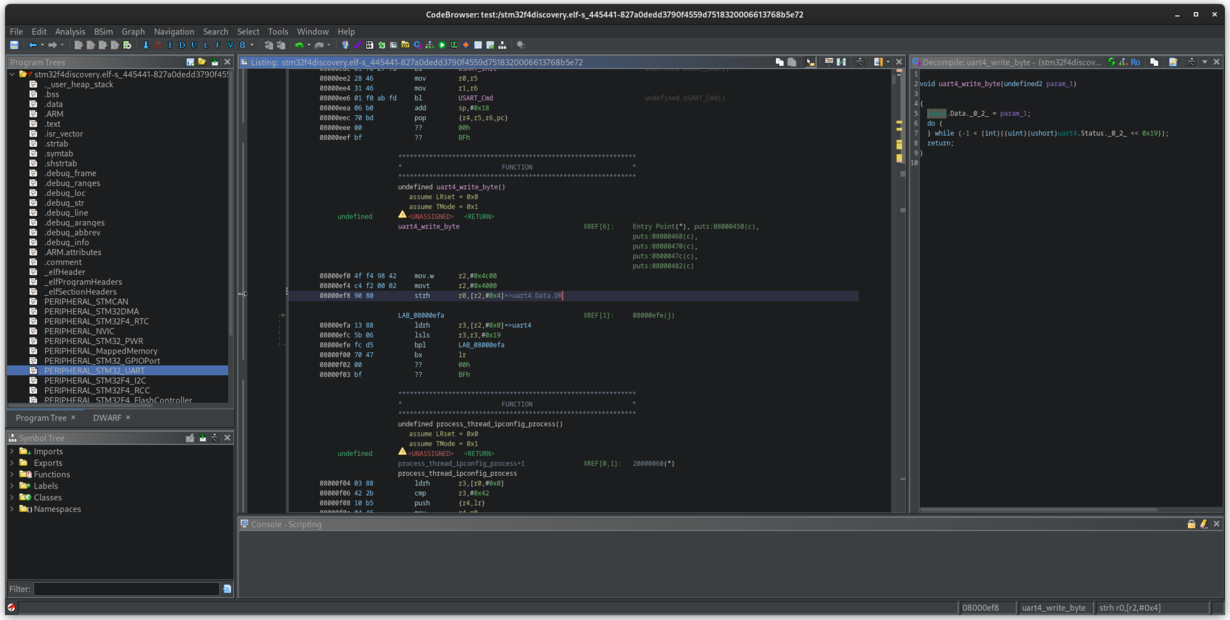
Analyzing a precompiled driver for I3C with girdl
To verify girdl’s functionality, we used the open source I3C project we have been developing within CHIPS Alliance for which RDL data is available on GitHub. By taking a compiled binary, given the RDL information provided with the I3C core, we can do a side-by-side comparison of the Ghidra analysis output with and without the plugin being used.
Just like with the STM32F4 example, you will first need to export the Peripheral Map of the platform from Renode. To do that, load the .resc file and use the peripheral export command.
As the name of the peripheral in Renode and the name defined in I3C RDL do not match, we have to patch the generated Peripheral Map by replacing Caliptra_I3C with I3CCSR. We also had to provide two macro definitions, CONTROLLER_SUPPORT and TARGET_SUPPORT, to access all registers defined in the I3C RDL.
Patch the Peripheral Map on Linux using: sed -i 's/Caliptra_I3C/I3CCSR/' guineveer.json
After the analysis, a new section called PERIPHERAL_I3CCSR will appear in the Program Tree. When you navigate to it, you can see all the registers defined by that peripheral at its binding site, and, on the right, the references to them made by the analyzed program (detected by Ghidra).
When you check one of these references, you can see that it corresponds to the C strings used around it - that is, you can see the full i3c.Control name in the disassembly.
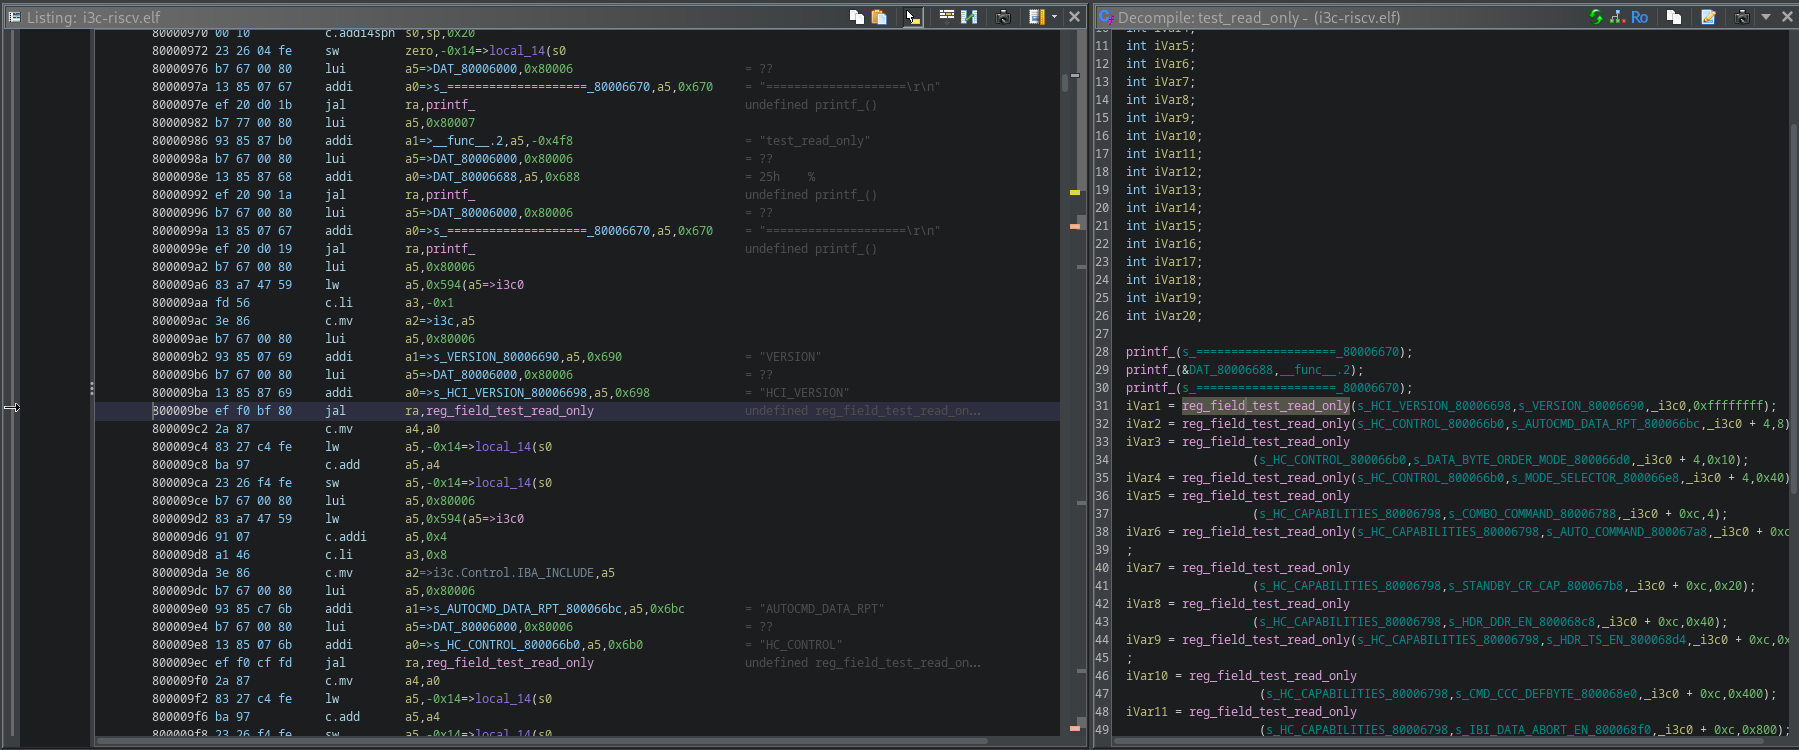
This information allows you to identify at a glance what the code does by just observing the peripherals (and the registers within) that it operates on, even when you do not have the debug symbols.
For comparison, here is what the same function looks like with and without the girdl plugin:
I3C accesses - no plugin 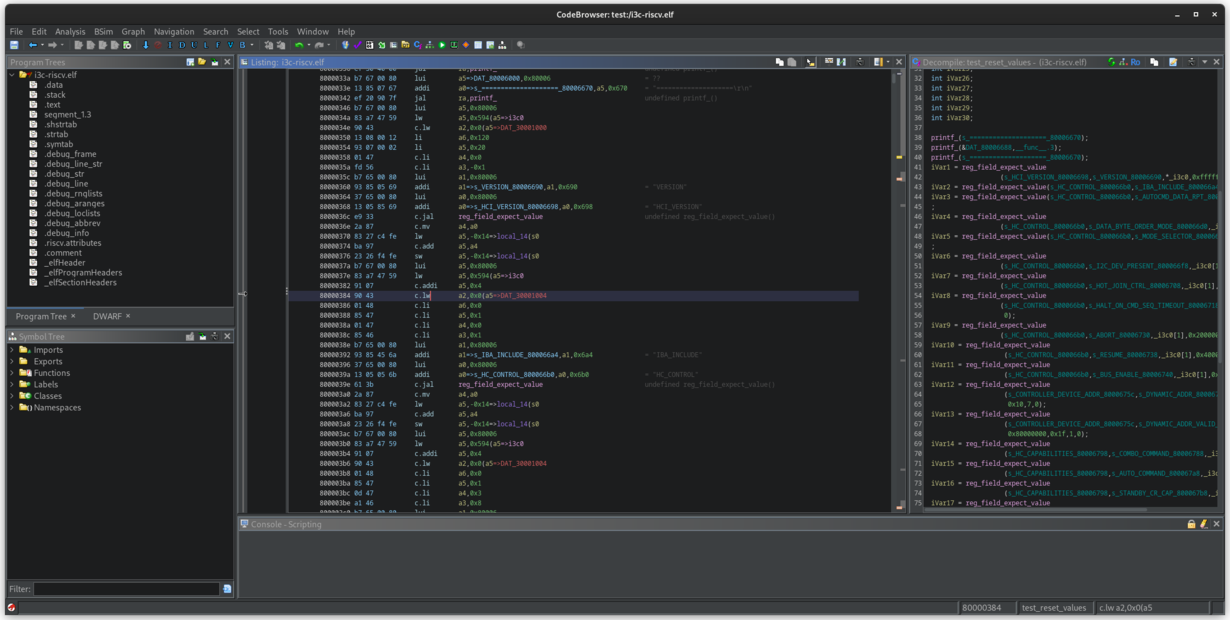
I3C with girdl 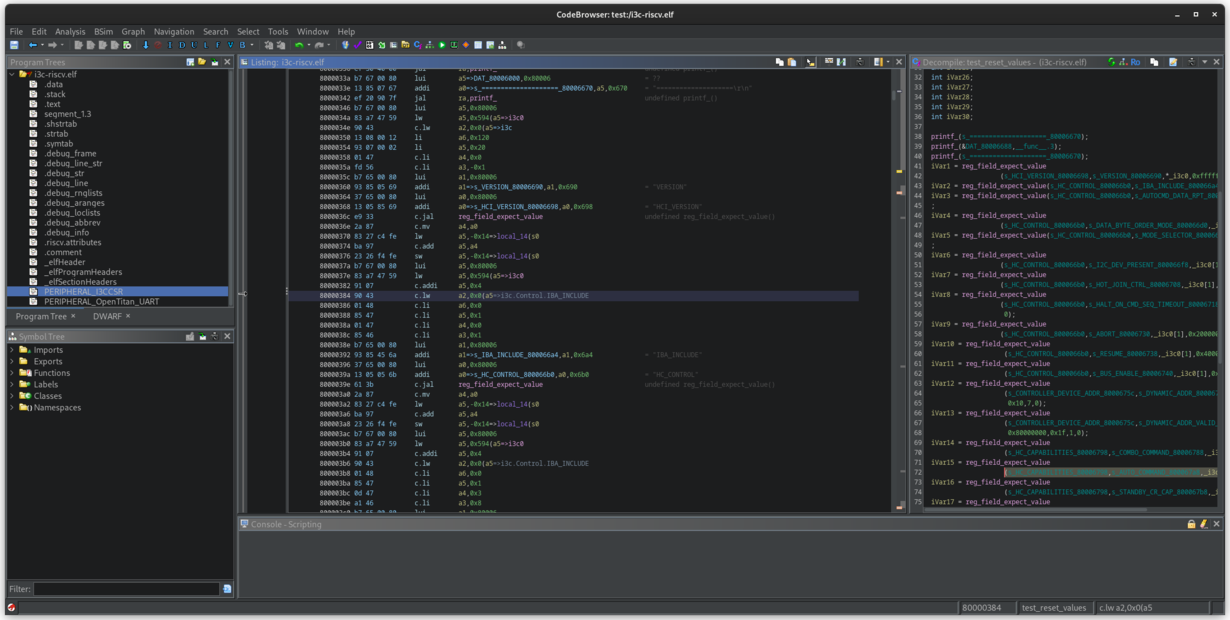
Automatic register analysis with girdl
Using girdl, you can leverage Ghidra’s advanced software analysis features to automatically parse register description files and gain a better understanding of their contents. This can be especially useful for debugging or when maintaining legacy code. By integrating the girdl plugin with Renode, we arrived at an interesting extension of the simulation framework’s usability by extracting data from it, e.g. to detect accesses to platform-specific peripherals, indicate which registers are accessed or which bitfields are set.
If you would like to learn more about girdl or Antmicro’s standardized approach to defining and managing register information across different designs and projects, don’t hesitate to reach out to us at contact@antmicro.com.