While developing FPGA designs it is important to keep track of resource usage and runtime to make sure that your development process is productive and your FPGA hardware delivers the best possible results. This is where one of our more recent developments, SymbiFlow’s FPGA tool perf can be of immense help. It’s an open FPGA tooling project we have been using in various projects and heavily contributing to in recent months. The aim of FPGA tool perf is to provide a comprehensive end-to-end FPGA synthesis flow and FPGA performance profiling framework.

The idea behind the framework is to analyze your FPGA design with respect to different metrics, such as clock frequency, resource utilization and runtime as it is being developed. The project sets up a test environment letting you choose from a variety of supported open source and proprietary tools and flows, and then performs an exhaustive run of all the test designs against the selected configuration. To do so it uses Edalize (which we’re also adding new features into at a good pace), which helps in preparing each build for testing by automating the usage of your preferred tools. Once the test is finished, it extracts all the relevant data from the performed runs and proceeds with its analysis. The framework also aims to collect information on statistical confidence, meaning that the designs are run multiple times to see how results change in relation to changes in the input conditions, as well as to make sure that output result remains the same with unchanged input conditions - for e.g. CI / regression testing purposes.
How it works
FPGA implementation involves two major processes, which are handled by EDA tools: Synthesis and Place & Route. The FPGA tool performance framework uses combinations of tools for those processes to evaluate the test designs. The platforms that are supported include:
- Xilinx
- Lattice
- QuickLogic
- QuickFeather
- Chandalar (internal platform)
Various toolchain configurations can be used to run a set of test designs to verify quality of results and the runtimes needed to obtain a working bitstream. The included tests cover a variety of designs which range in complexity, from a simple blinky design that switches LEDs on and off, to complex SoCs, such as PicoSoC, various Linux-capable LiteX SoCs or OpenTitan’s Ibex core.
Once all the tests have been run, relevant information is collected and presented in a convenient data structure (pandas DataFrame) to make the data analysis easier. Below you will find some examples of how the data is visualised.
Clock frequency 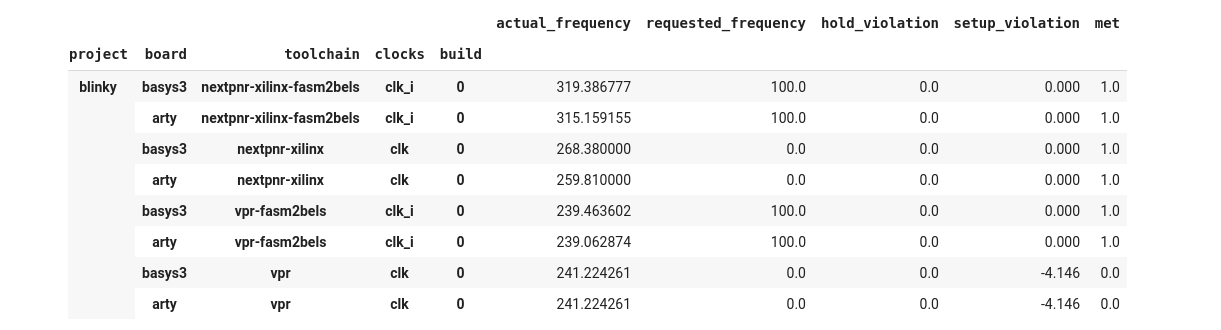
**Runtimes** 
**Resource utilization** 
Summary and way forward
Given that different tools behave in different ways and platforms/FPGAs have varied architectural setups, being able to analyze their behavior on a varied set of designs allows to determine which tool is the best for the job. Thus, the FPGA tool performance framework allows developers to achieve better results by pointing to where (and how) code can be optimized and to determine if the results worsen e.g. after an tool update or a seemingly trivial change. This is a fundamental tenet of our development methodology - open source tools and methodologies to assess their results in a regression testing methodology mean that the entire flow can be constantly improved. If you’d like to build an FPGA design where these qualities are important, let us know at contact@antmicro.com and let’s see how we can build your next system using open source components and software-driven flows.


