The OpenROAD project provides an open source ASIC toolchain that reduces the entry barriers to the field of hardware development and allows fast-turnaround feedback about your design, helping increase productivity of silicon teams. As such, it’s a great supporting tool, used not only in education and academia, but increasingly also for state-of-the-art industrial projects.
Antmicro has been helping early adopters of OpenROAD-based flows in projects such as SkyWater Shuttle, OpenTitan or more recently, Google’s XLS. Now, as the open toolchain is seeing more widespread industrial use, just like in the case of other tools we work with like Verilator, we are seeing interest from customers in improving the performance of OpenROAD to yield faster turnaround times, especially for large and complex designs.
In this note, we will describe the intermediate results and workflow of an ongoing project focusing on improving execution time of the mainstream OpenROAD flow at the Floorplan, Placement, Clock Tree Synthesis and Routing stages. The general idea of that project is to suggest technical, general software optimizations, e.g. improving data structures or refactoring code for efficiency and scalability. This description focuses on methodologies we used for identifying bottlenecks in the flow, optimizations introduced, as well as considerations and suggestions for the future of the project.

Methodologies for identifying bottlenecks
To reliably assess wall-clock runtime and locate potential bottlenecks in the process, we used several profiling tools:
- Valgrind’s Cachegrind and Callgrind - allows to collect precise information on cache usage, as well as generate a graph of calls that are easily portable and supported by various tools, such as KCacheGrind or speedscope (making it especially handy for Continuous Integration pipelines),
- Linux’s perf tool - a capable profiling tool utilizing Performance Monitoring Unit in hardware to collect runtime statistics directly from the CPU, instead of using e.g. simulation (as in Valgrind) to collect such metrics on a software level, giving detailed information on processing time without introducing any significant overhead, which is especially useful during local development
- pprof and related tools that allow to visualize results from
perfin the form of flamegraph, runtime graph demonstrating time spent on a given method and in total with its callees, - Intel VTune Profiler to cross-reference the results gathered the otherwise open source toolkit with another widely-used tool.
As our testing targets, from the example designs already available in the OpenROAD flow scripts repository, we selected several RISC-V cores of various complexity which represent realistic use cases of the OpenROAD flow and are therefore expected to exercise all of its individual algorithms.
- tinyRocket - a size-reduced version of rocket-chip,
- Ariane - an earlier version of CVA6,
- Ibex - lowRISC’s Ibex core,
- BlackParrot - a modified version of black-parrot with memory blocks generated using bsg_fakeram for nangate45 PDK.
As they are open source, the designs also have the benefit of being fully reproducible, and the related performance results can be published to facilitate collaborative workflows for measuring and improving OpenROAD performance.
Performance evaluation CI flow
To get a dependable environment for measuring performance improvements, we have developed a Continuous Integration flow that runs the profiling and generates reports on performance changes. The CI setup runs the OpenROAD toolchain for the four reference designs, then builds them using OpenROAD-flow-scripts. The OpenROAD project is then checked out to the branch that is being profiled, together with its submodules.
For each design, OpenROAD is run in four modes:
- Release - to verify the performance of the optimized code. The design is built 10 times in order to determine an average duration of each stage; all other modes are executed once.
- GProf - built with
-g -pgcompiler flags to enable profiling viagprof. - Callgrind - run with Valgrind’s Callgrind tool.
- Intel VTune Profiler - to profile and detect hotspots in optimized code.
Each design is tested whenever changes are applied on development branches. The ASIC build process in OpenROAD is divided into passes, such as synthesis, floorplanning, placement, clock tree synthesis, or global routing. The optimizations we are introducing can affect multiple passes (e.g. one algorithm used in several passes) and sometimes the results of a single pass can further affect the passes that follow. Due to this, the flow tests the performance of all passes for the implemented optimizations.
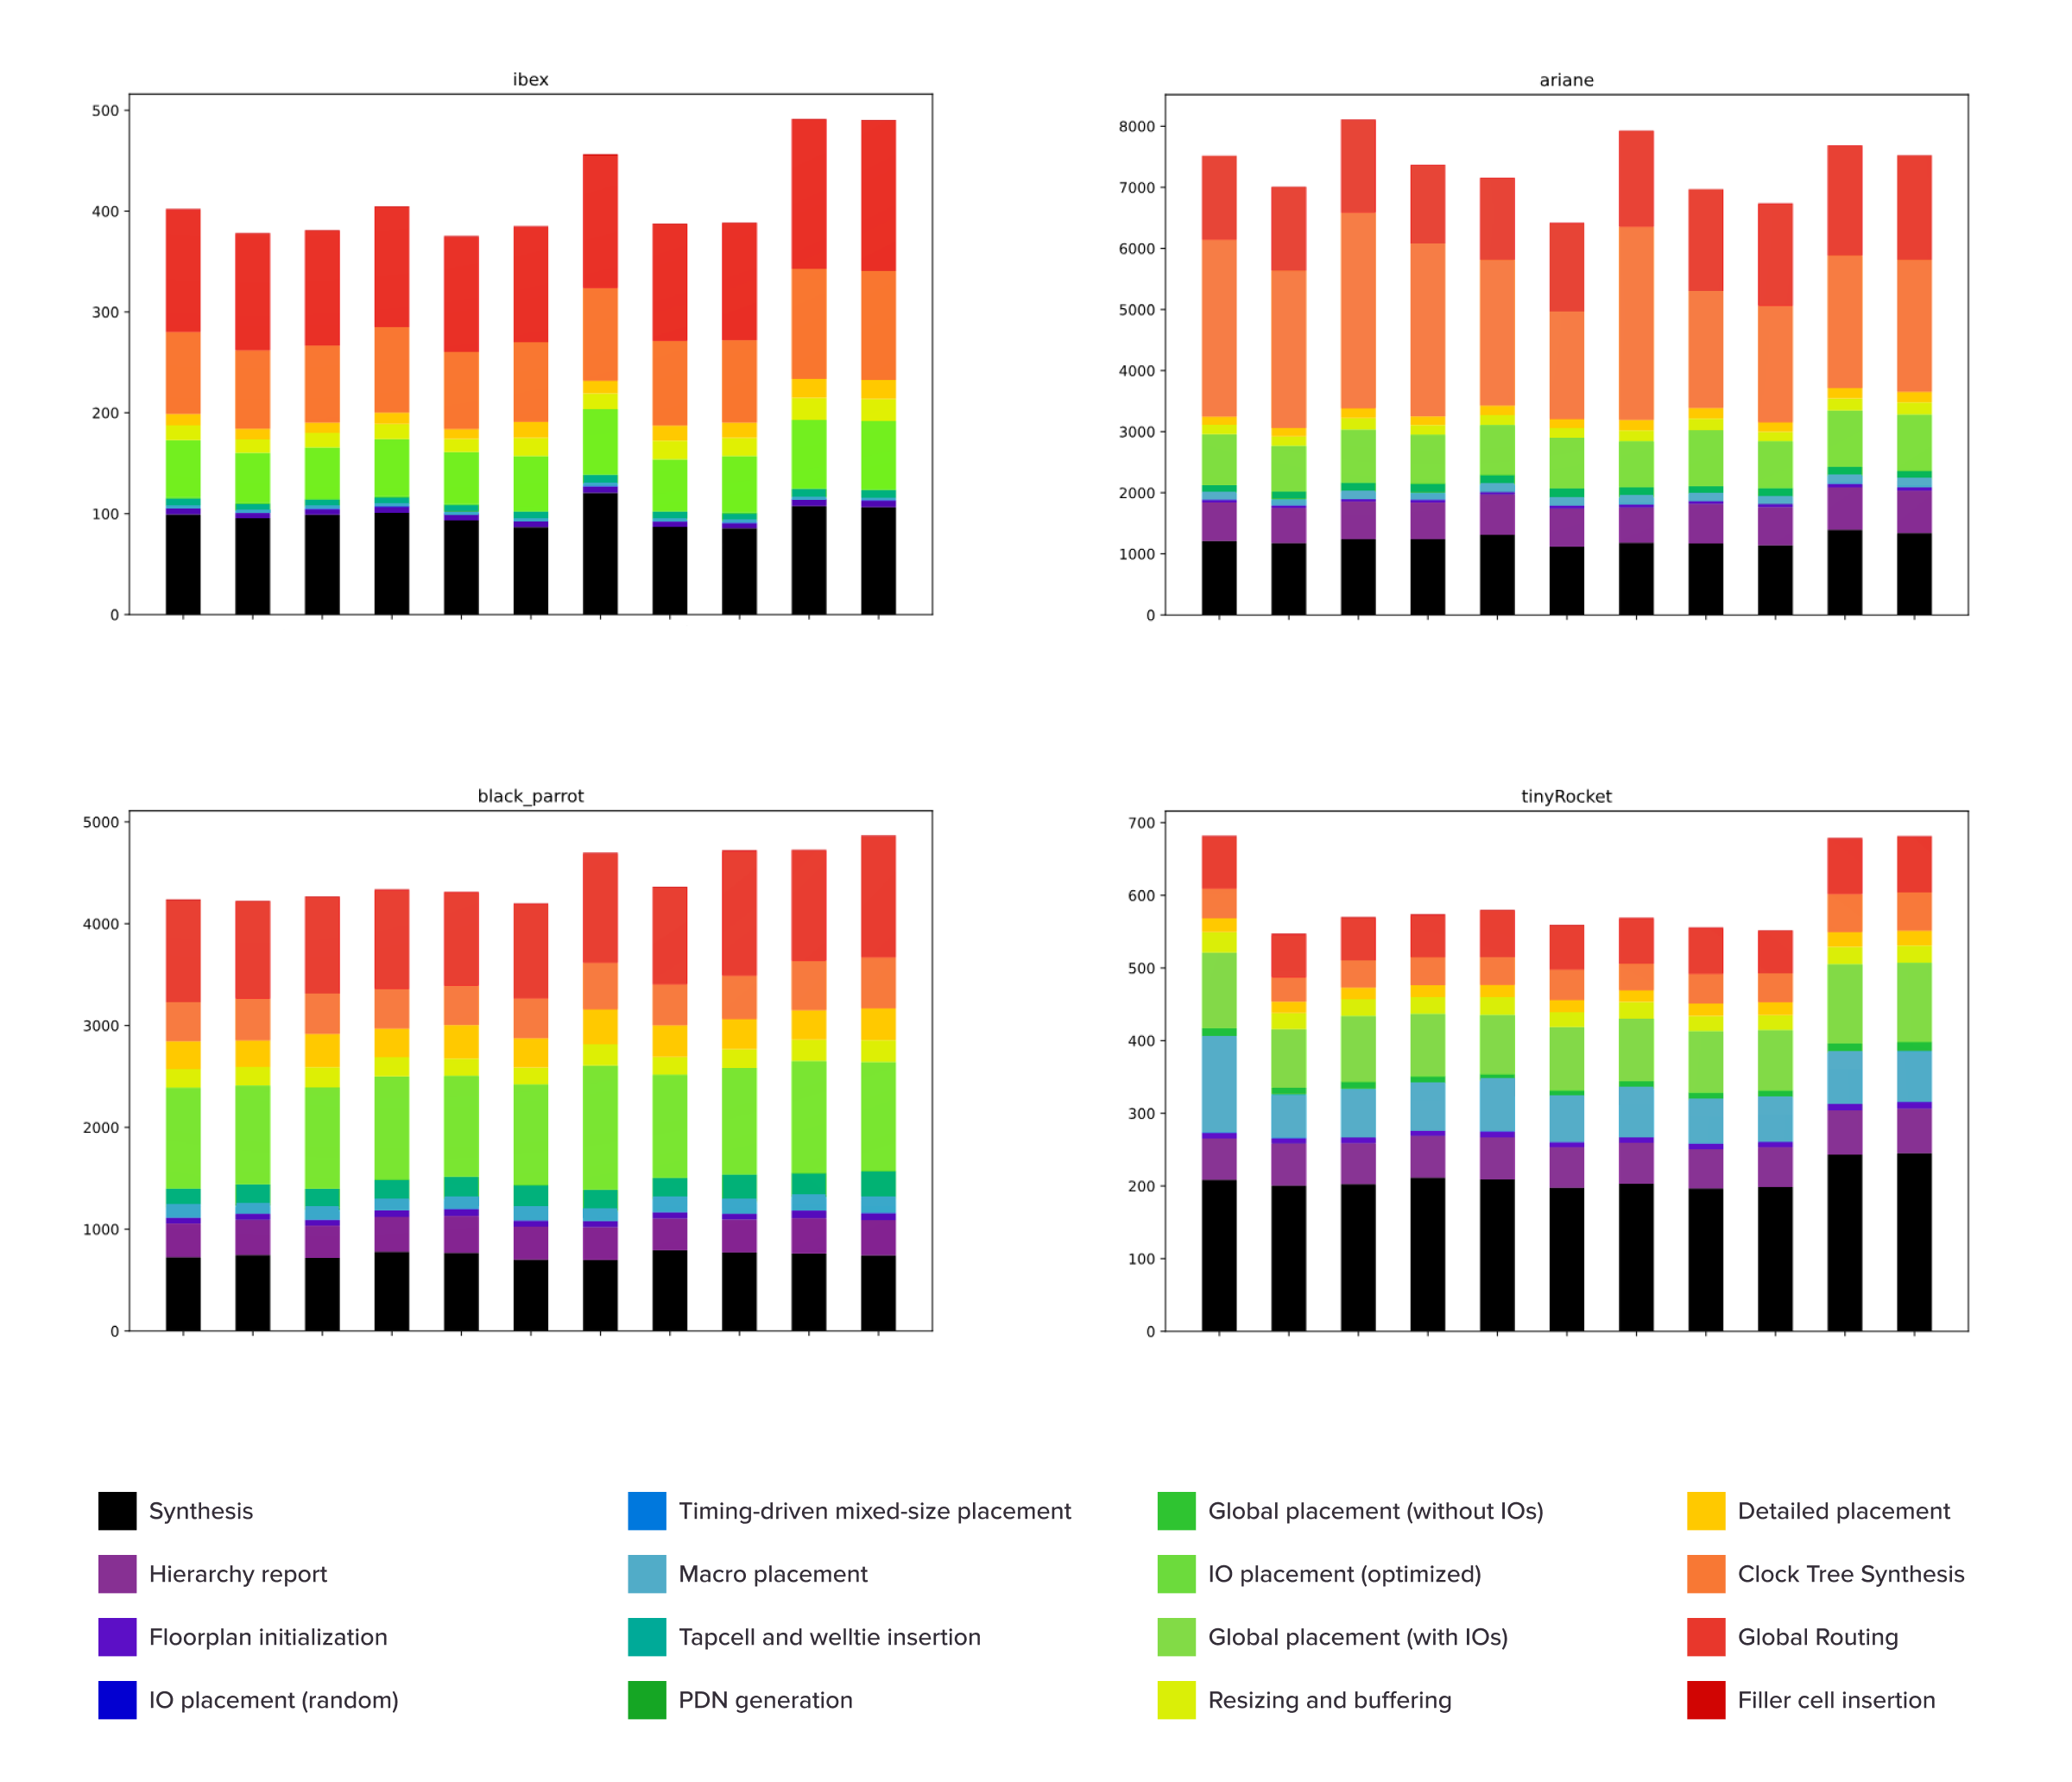
The results for each pass are returned as a CI job artifact which contains the log, gprof output, Callgrind output, VTune output, and build results. These can be later used to generate column charts representing the duration of every stage in each run:
Additionally, we use SpeedScope flamegraphs to visualize how each function from the Callgrind run affects the overall execution, as shown in the example below:

We’ve created an auto-generated report presenting Callgrind results for the design build steps in the OpenROAD project, which we use to determine bottlenecks in the code and discuss the findings. The interactive report is in the process of being expanded to cover more graphs like the ones depicted above.
Below, we describe the most impactful changes we introduced so far to the OpenROAD project; the project is, however, under active development by both Antmicro as well as other contributors so that list is by no means comprehensive.
Floorplan and Placement optimizations
Functions used for setting macro positions in the OpenROAD flow contain conditionals that depend on unused data fields. Even though these conditions are always fulfilled, they were still being checked extremely frequently, which negatively impacted performance. By removing these superfluous conditions, we managed to achieve a ~20% reduction in the macro placement execution time on Ariane.
When it comes to the Global Placement stage, we implemented several improvements. By reducing the number of pin location lookups in the Steiner tree construction, we managed to speed up Global Placement by about 7-8%, as shown in the table below. The number of such reads can potentially be reduced further, but this will require redesigning some data structures.

We also adjusted the pdr::get_nearest_neighbors() function to use a single static vector instead of multiple separate ones. It also made the lambda used in that function capture a vector by reference instead of by copy. This resulted in fewer allocations, better cache coherence and reduced the amount of copying, yielding a 5-8% speedup in Global Placement.
In the Detailed Placement stage we introduced a few simple optimizations to the DetailedMis::gatherNeighbours function. Those change the type of the container, simplify the conditions and reorder them, and evaluate a function call only if needed, resulting in Detailed Placement runtime decrease by ~4.7% (as measured on BlackParrot).

The Placement stage now includes initial attempts to parallelize the execution: there is one loop in the multi-bit flip-flop (MBFF) pass marked with an OpenMP pragma. As OpenMP is already a dependency of Global Placement, we used OpenMP to parallelize Nesterov’s method for the gradient optimization which is used by this stage. This resulted in a 6% speedup of Global Placement in Ibex, 10% in BlackParrot, and 7% in Ariane.

Global Routing optimizations
The Global Routing stage consists of a small part of OpenROAD-specific code, with the majority taken up by the Gate Resizer (RSZ) module and the external OpenSTA library. Below, we discuss our improvements to the former, as the work on OpenSTA improvements is not part of mainline OpenROAD yet.
We optimized RepairSetup::rebufferBottomUp, which used to take a significant amount of time during the repair after Clock Tree Synthesis, by implementing three types of changes:
- preallocating vectors, the final length of which is usually known in advance,
- caching values used by the comparison function during sorting done in the method in order to avoid redundant floating point calculations,
- reducing time complexity of option pruning at the end of the method from pessimistically quadratic to linear complexity.
These optimizations speed up CTS mostly for designs that require a significant amount of time for RSZ, such as Ariane, for which we observed a ~80% time reduction.
Averaged outcomes from 10 runs on the target designs are shown below:

Introducing parallelism
The efforts described above have already resulted in significant runtime improvements, however, there’s still potential for even more optimization that we are currently exploring.
One of the methods that could yield promising results is parallelization by scaling the flow on many CPU cores. In theory, this is the obvious thing to do, and - especially for large designs - the more cores, the better. In practice, however, parallelization requires synchronization of the processing threads and implementing additional critical section guarding to prevent race conditions and data corruption. These synchronization mechanisms, if overused, can significantly slow down performance, so any gain from parallelization might be lost on synchronization of the threads. The focus of this work is on finding such bottlenecks and improving synchronization so that we can spawn more processing threads.
With this in place, it would be possible to scale up OpenROAD workloads into the cloud to yield even shorter turnaround times. On top of that, the design could be partitioned in order to spawn multiple parallel builds on many machines in the cloud, and without licensing limitations, you could potentially significantly shorten your ASIC development time.
We will report on the results of these efforts, together with our improvements in static timing analysis and other areas in a follow-on blog note later this year.
Adopt and improve open source flows for your use with Antmicro
To learn more about our work on optimizing the OpenROAD toolchain, join us on April 15 for a talk at the Open Hardware and Software Mini Summit, hosted by CHIPS Alliance, RISC-V International and OpenPOWER during Open Software Summit North America.
Developing, optimizing, integrating and improving open source workflows and toolkits is a large part of Antmicro’s day to day work for customer projects as well as for our own R&D. If you would like to identify and eliminate bottlenecks via integrating automated workflows in your project or adopt open source productivity tools that streamline your ASIC design and software work, reach out to Antmicro at contact@antmicro.com.


