Antmicro’s open source Coverview tool facilitates automated generation of interactive coverage dashboards for a variety of use cases. In a recent blog article we described its application in digital design projects, for RTL coverage visualization and analysis.
Coverview is universal and customizable by design, which means it can be easily integrated with other tools and CI-CD based workflows. This made it easy to integrate Coverview with our open source Renode simulation framework, which, in combination with Renode’s own extensive execution tracing features, provides a complete solution for analyzing and visualizing code coverage for embedded software.
In this article we describe Renode’s integration with Coverview, as well as various improvements we have added to Coverview since its introduction.

Coverview integration with Renode
Coverview uses several different types of input files, including the LCOV (Linux Coverage Visualizer) format (.info files), a custom .desc format, and the project sources. The resulting coverage dashboard can be deployed with your code in a CI setup, or you can use the Coverview version deployed on GitHub pages to load a dedicated .zip archive and view your coverage data. For detailed usage instructions and customization options, refer to Coverview’s README.
The integration of Coverview with Renode builds on top of the simulation framework’s execution tracing features, which are themselves extremely useful for debugging.
Renode can generate detailed traces of execution of the unmodified binaries it runs using a single command:
cpu CreateExecutionTracing "tracer_name" @path-to-file <mode>(with tracer_name being the object handle you want to use to control the tracer and PC, Opcode, PCAndOpcode and Disassembly as the available modes - for more details see the documentation item above)
After the trace is saved, a post-mortem analysis is performed by the coverage generation tool, which translates the values of the program counter (PC) recorded during program execution into line numbers of the program’s source code. This approach allows you to track line coverage of an executed application without additional instrumentation of the code, which is the typical approach used by tools like gcov. By default, the renode-retracer tool, which parses execution traces and generates coverage reports, will generate .info files. The previous text-based format, described in more detail in an earlier article, will remain as a “legacy” mode.
You can read more about generating coverage reports in Renode’s documentation, where you will find a tutorial that will walk you through the process of reporting code coverage for a simple baremetal application and, to test a more comprehensive example, for a Zephyr shell_module sample running on an emulated Nucleo H753ZI board. The tutorial will guide you how to build the Zephyr application with reduced optimizations, how to prepare and run a simple test case to gather the coverage information and, finally, how to translate the generated trace data into a Coverview dashboard.
Recent improvements to Coverview
We’ve been gradually improving Coverview since its introduction, which includes improvements to Coverview itself and the complementary info-process tool, as well as various user experience enhancements.
General recent improvements to Coverview include:
- fuzzy file search
- switching between tree view and flat view
- hiding files without coverage
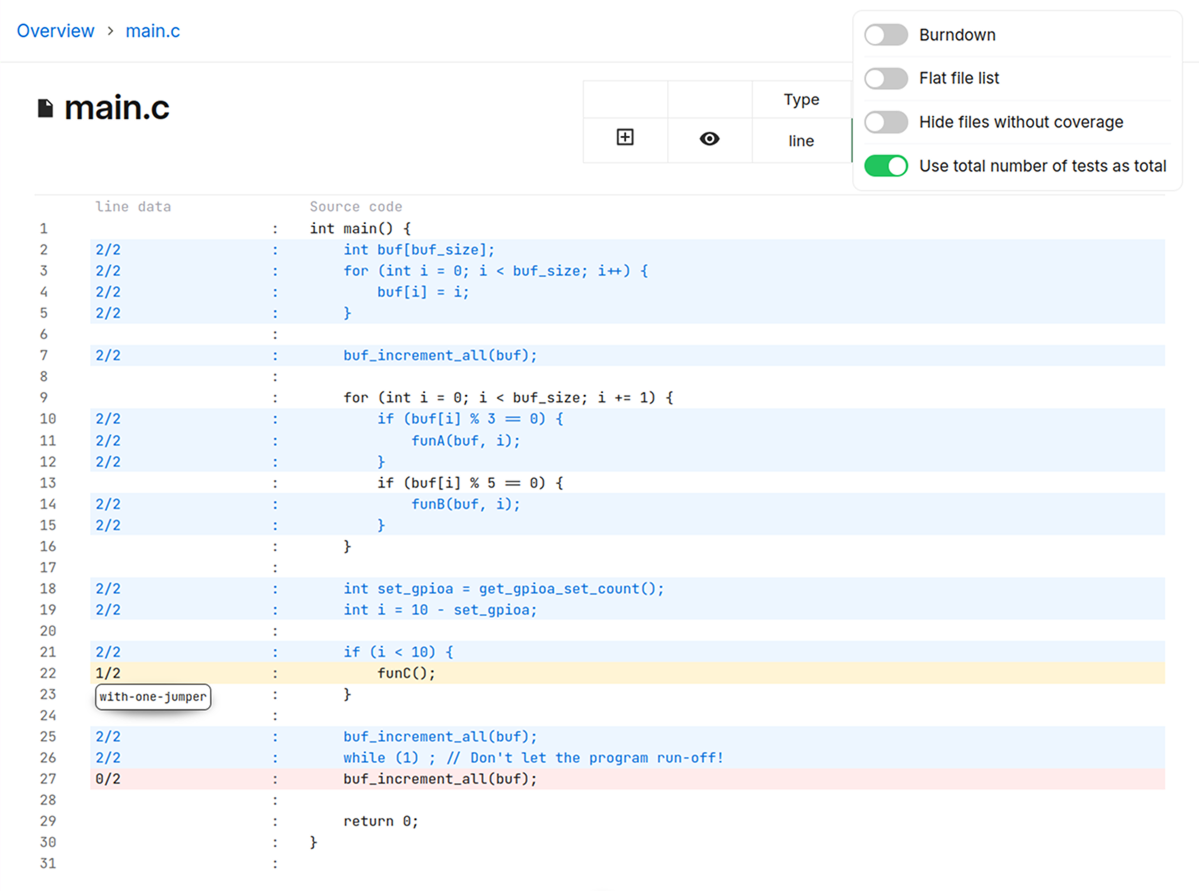
- a new way of calculating line coverage annotations: displaying the number of executed tests hitting a specific line out of total tests.
In terms of UX, we added line range highlighting, long lines wrapping and linked line highlighting, as well as unified source paths.
Beyond Coverview itself, we extended the renode-retracer tool to enable result aggregation, which in turn enables creating aggregated coverage reports for multiple test cases / test runs. We also introduced some general improvements to info-process used for creating Coverview input archives, including an option to compare coverage between two .info or two .zip files, and to generate diff archives.
Comprehensive code coverage reporting with Renode
Thanks to Renode’s integration with Coverview, you can easily generate and analyze coverage dashboards of your code being executed as-is in simulation, without additional instrumentation. With additional features for improved debugging, including network traffic and cache usage analysis, Renode can help you identify bottlenecks and opportunities for optimization.
If you’re interested in integrating Renode and Coverview with your workflow, reach out to us at contact@antmicro.com. We offer comprehensive engineering services complemented by a broad portfolio of open source tools that can help you streamline software-hardware co-design, testing and verification.


